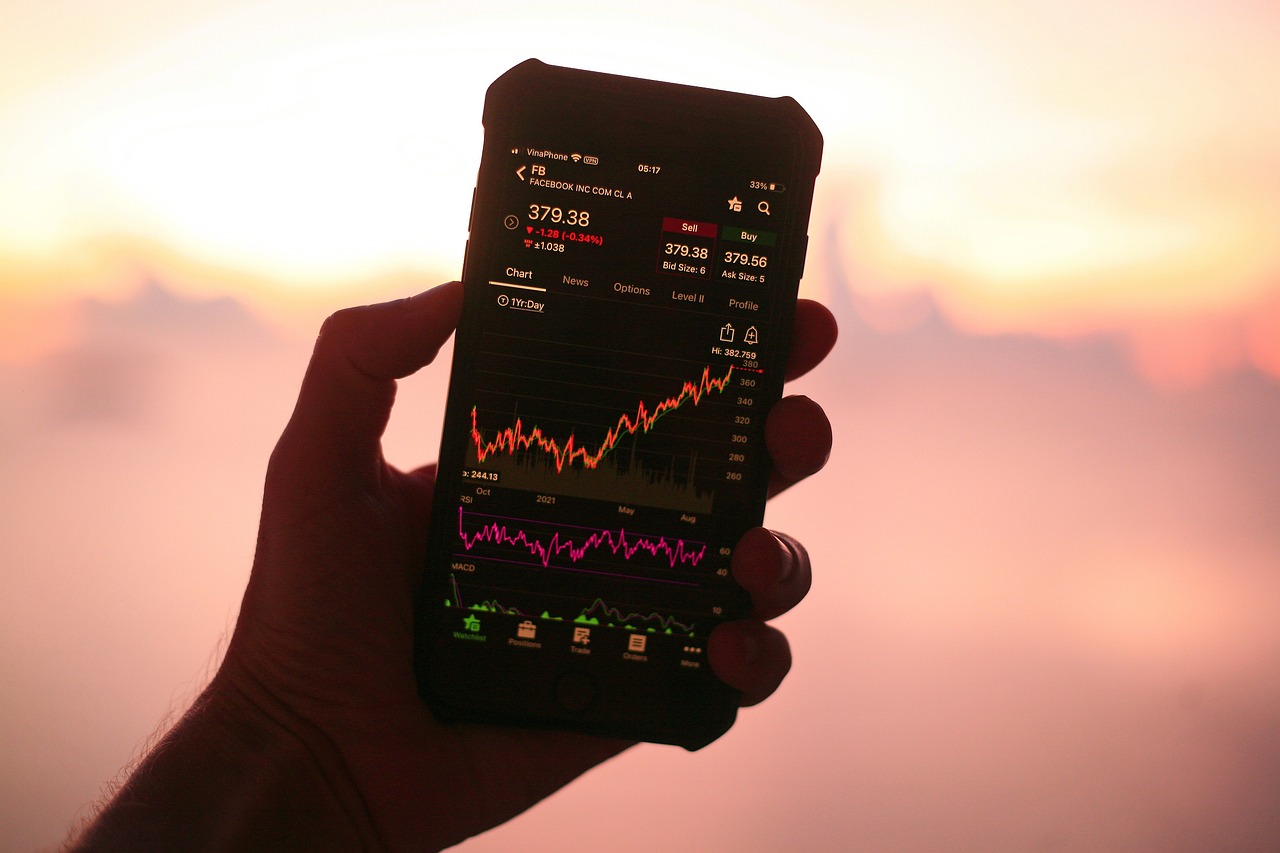
Crypto trading indicators play a very important role in decision making and by using such tools and indicators crypto traders achieve success through trading. I will share with you two indicators of a slightly advanced level in three consecutive posts.

I am hoping to share with you a total of six indicators through three posts which are somewhat advanced level and hopefully, you will be able to understand very easily as I have tried to explain things with examples. Intermediate, professional, and advanced traders often utilize more sophisticated trading indicators and tools to gain deeper insights into market dynamics and make more precise trading decisions. Below are some advanced trading indicators commonly used by experienced traders-
1. Ichimoku Cloud
The Ichimoku Cloud, also known as Ichimoku Kinko Hyo, is a comprehensive indicator that provides information about support and resistance levels and trend direction. The Ichimoku Cloud consists of several components like followings-
Tenkan-Sen (Conversion Line): A moving average of the highest high and lowest low over the last nine periods.
Kijun-Sen (Base Line): A moving average of the highest high and lowest low over the last 26 periods.
Senkou Span A and Senkou Span B (Leading Span A and B): These lines form the cloud, or "kumo," which represents future support and resistance levels. Senkou Span A is the average of the Tenkan-Sen and Kijun-Sen plotted 26 periods ahead. Senkou Span B is the average of the highest high and lowest low over the past 52 periods, plotted 26 periods ahead.
Example:
Traders use the Ichimoku Cloud to identify trend direction by observing the position of the price relative to the cloud. If the price is above the cloud, it indicates an uptrend, while a price below the cloud suggests a downtrend.
2. Fibonacci Extensions
Fibonacci Extensions are used to identify potential price targets beyond the typical retracement levels provided by Fibonacci retracement. Fibonacci Extensions are drawn by identifying key swing points in the price action and applying Fibonacci ratios to project potential future price levels. The most common Fibonacci Extension levels are 127.2%, 161.8%, and 261.8%.
Example:
After a significant price move, traders may use Fibonacci Extensions to identify potential areas of resistance or support where they can take profit or enter new trades.
~ Regards,
VEIGO (Community Mod)

