Solidus Ai Tech (Bitget: AITECHUSDT) has broken out of the triangle pattern in the four-hour chart.
https://i.postimg.cc/gjJ2cFMx/Nimet-n.png
(Chart courtesy of Tradingview.com(log scale))
Elliott Wave Analysis
In Elliott Wave terms, AITECH began a red wave one advance on February 4. The red wave one peaked on February 26 and the red wave two correction ended on February 29. The red wave three (blue sub-waves i-ii-iii-iv-v) finished on March 13 and the red wave four (blue sub-waves a-b-c) correction ended on March 27. If this wave count is correct, AITECH should be heading next towards the March 13 peak in the red wave five.
https://i.postimg.cc/tTrqYqmh/nimet-n2.png
(Chart courtesy of Tradingview.com(log scale))
Funnymentals
AITECH serves as a payment gateway for licensing Artificial Intelligence-as-a-Service (AIaaS), Blockchain-as-a-Service (BaaS), and renting HPC power through their Infrastructure-as-a-Service (IaaS) platform. LecksMoney reviewed the project one week ago.
(Sources: https://aitech.io)
How Will Solidus Ai Tech Trade?
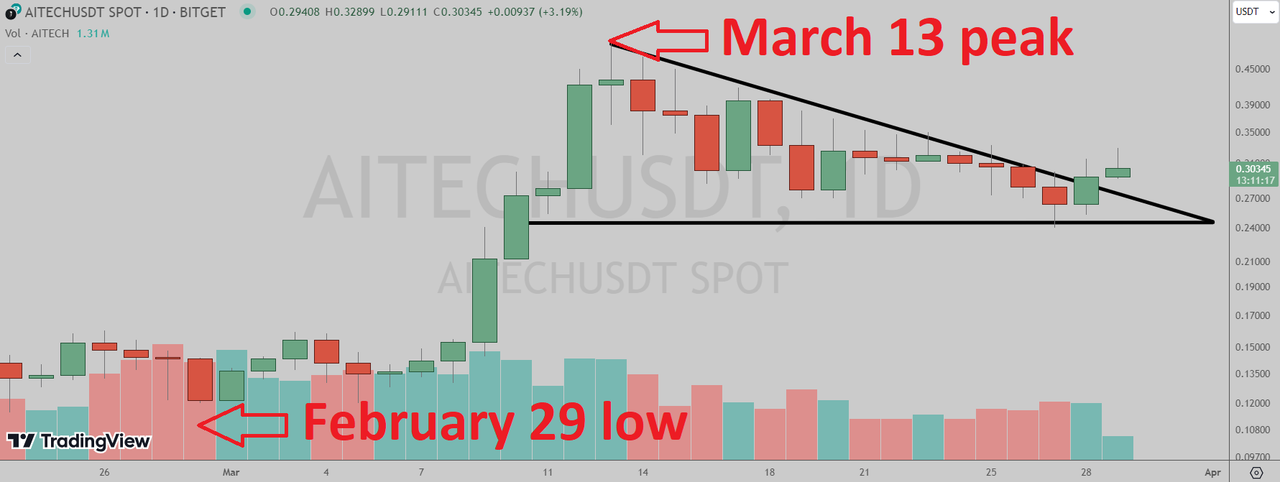
Solidus Ai Tech (Bitget: AITECHUSDT) daily chart by Tradingview.
https://i.postimg.cc/bwVKqvY1/nimet-n3.png
(Chart courtesy of Tradingview.com(log scale))
Prizes
I will be giving upvotes to the correct answers (posts only).
Rules
This poll will expire in one week. Only one vote per person.
Which one will happen first?
Please select one of the three choices and comment below
AITECH will takeout the March 13 peak
AITECH will drop below the February 29 low
AITECH will stay in a trading range between the February 29 low and the March 13 peak until May 4