
Технічний аналіз (далі ТА) в торгівлі криптовалютами відіграє таку ж роль, як і скрізь, де він застосовується. Він дає змогу оцінити ситуацію та прийняти рішення, без необхідності мати багато глибоких знань. Тобто орієнтуючись на деякі основні особливості, виражені візуально та технічно, можна приймати вдалі торгові рішення. Навіть професіонали із багаторічним досвідом, зауважують, що простота буває значно кращою.
Основні принципи ТА полягають у його легкому сприйнятті та застосуванні, складних, на перший погляд, механізмів. Їх можна розділити на два типи:
+ індикатори - в основі мають математичні розрахунки та різні об'єктивні дані, як то MACD чи Ковзаючі Середні;
+ графічні - починаючи від простих ліній підтримки й опору та похилих трендових, до різних патернів. Останні є послідовними комбінаціями від декількох свічок як у "Price Actin", до значно більших структур, як-то "Голова та Плечі" (ГіП), "Ведмежі вуха" та інші.

Тренди мають три напрямки:
+ Висхідний - зростання ціни в напрямку до верхнього правого кута графіка. Максимуми вище нових мінімумів. Градус нахилу, для хорошого має бути десь 45'. Добрий для покупок з утриманням позиції, щоб прибуток ріс.
+ Низхідний - зниження ціни із прямуванням до нижнього правого кута. Максимуми поступово стають нижче мінімумів. Добрий для продажів на ф'ючерсах та інших інструментах, що дозволяють заробляти коли вартість падає.
+ Боковий (рендж або флет) - ціна ходить в горизонтальному каналі, без вираженого напрямку. Часто відбившись від верху, прямує до низу, й так не визначений період. Залежно від сили та положення, може розглядатись як тимчасова торгівля - buy чи sell.
Рівні, це одне із найпростіших відображень важливих психологічних та наторгованих ділянок від яких ціна із більшою ймовірністю відштовхнеться. 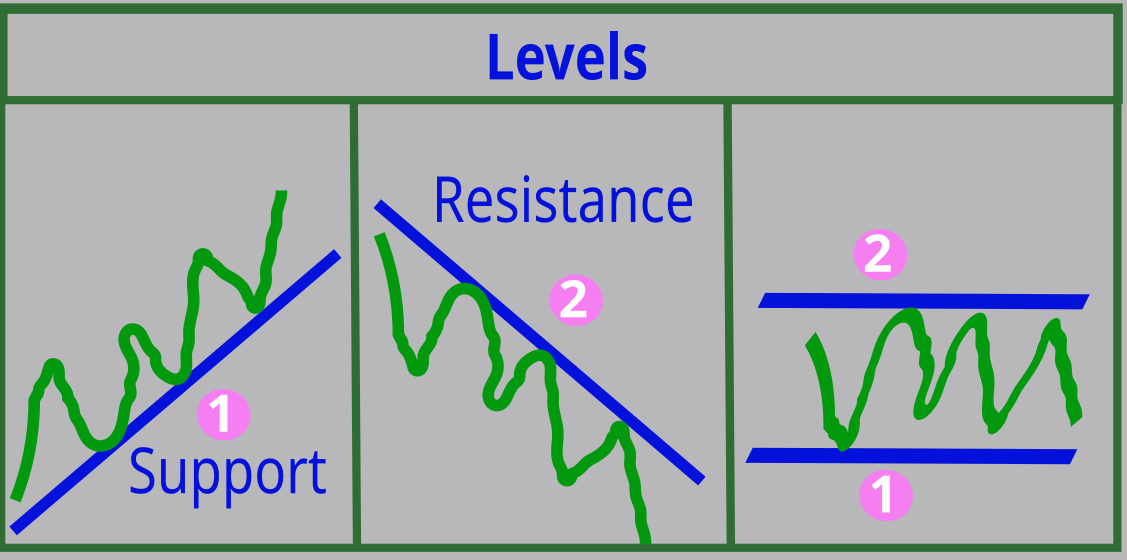
Їх можна розділити на:
- горизонтальні - можуть зберігати свою силу довгий час, залежно від історично-психологічної значимості;
- похилі - лінії під певним кутом нахилу, що часто є ознакою ведмежого чи бичачого тренду. Пробиття чи виражене закріплення під ними, може означати про зміну тенденції або перехід у флет;
- динамічні - формуються за певний проміжок часу, наприклад, якщо це Ковзаючі середні, то лінія буду змінювати положення в ході активних торгів.
Психіка людини має повторюваність поведінки, що притаманно й торгівлі на фінансових ринках. Процес торгівлі, який відображається на графіку торгового інструменту, набув певних ознак. Ознаки втілились в певних малюках зі свічок чи барів. Тобто стали схожими на звичні нам геометричні фігури чи інші моделі, котрі можна впізнати переглядаючи історичні дані. Їх багато, від простих до складних. Однак, можна розглянути для прикладу найвпізнаваніші:
1. "Голова та Плечі" (ГіП) - схожі на фігуру людини.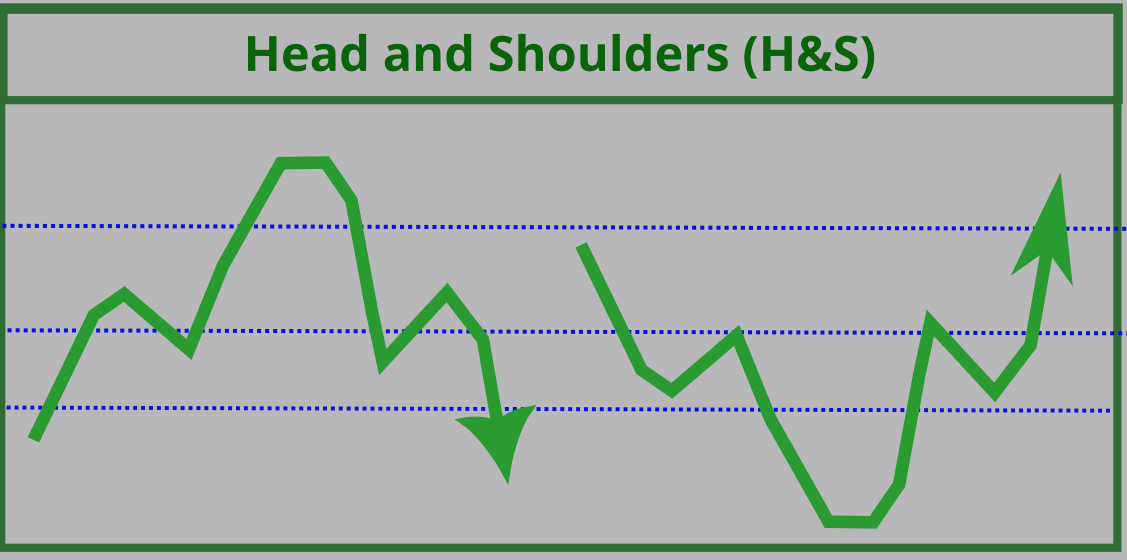
2. "Подвійна вершина" - в народі, ще називається "Ведмежі вуха".
Обидві є характерними передвісниками, зниження вартості, хоча не гарантують цього. Також вони мають свої протилежні віддзеркалення: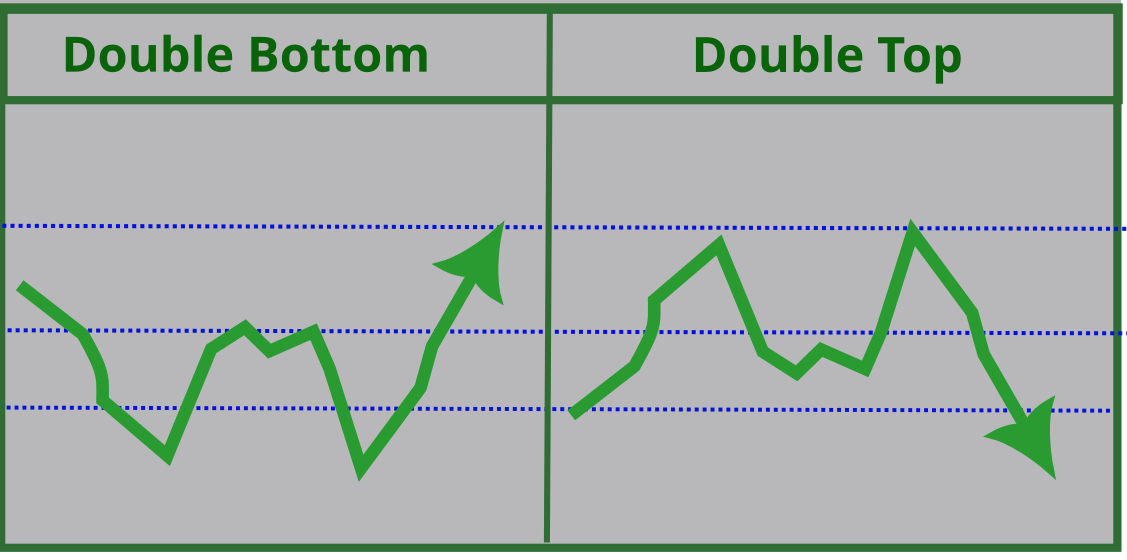
Індикатори нам дають швидкий доступ до статистичних даних. Маючи повторюваність, їх можна використати для торгівлі. Наприклад, Лінії Болінджера є Ковзаючою Середньою із більшим набором параметрів, де є ще дві лінії, зі зміщенням вгору та вниз. Надаючи подобу каналу. Це надає одночасно й можливість оцінити напрямок тренду за рухом ціни між лініями:
+ висхідний - середня-верхня;
+ низхідний - середня-нижня;
+ боковий - верхня-нижня.
Також мати динамічні рівні опору та підтримки, не гарантовані, але вже кращі орієнтири ніж пальцем в небо.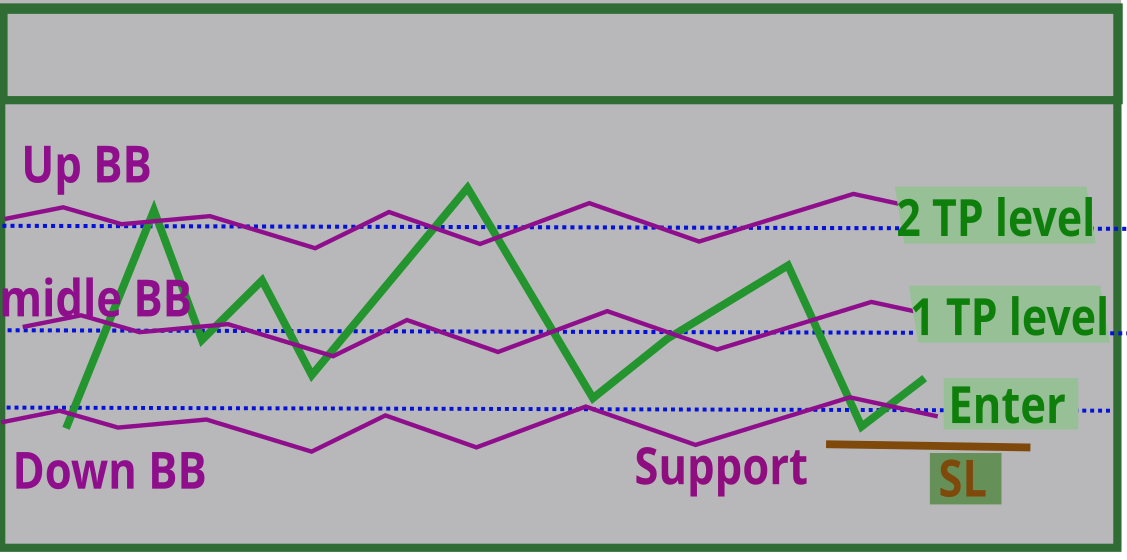
Приклад. Ціна багато разів подолала відстань між Лініями Болінджера "верхня-нижня" в ціновому каналі 0.14-0.18 STEEM/USDT. Отже, наступний підхід до нижньої, як підтримки, вже можна використати, як орієнтир для покупки по 0.14. А середню чи верхню лінії індикатора, як точки виходу на 0.1550 чи 0.1750, вони ж і цілі для тейк профіту.
Найпоширеніші патерни, самі по собі не є визначальними у трендах, бо важливими є також їхня сила та положення. Це значить, що на маленькому часовому періоді, вони можуть долати лише коротку відстань або сигналізувати про початок більшого руху. Однак на старших тайм фреймах, будуть не ефективними й бажаного результату не дати.
Трикутники характеризуються накопиченням, яке поступово стискається, тобто напруга протистояння обох сторін - продавців та покупців, зростає, а прорив в одну із сторін виливається в хороший стрибок ціни.
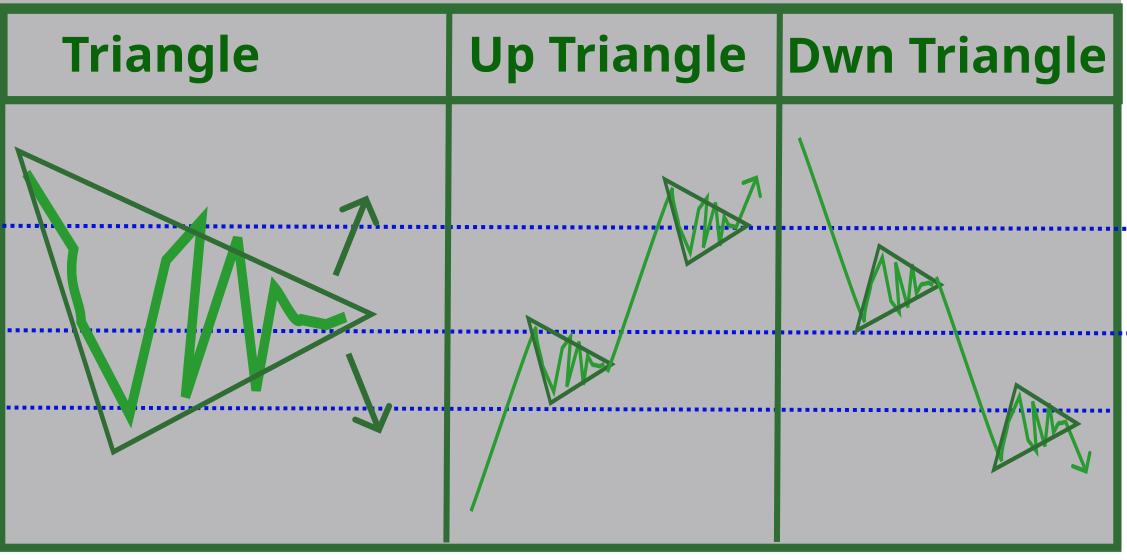
Також добре проявляють себе як підтвердження продовження розвитку тренду. Й мають назву вимпел, тобто трикутний прапорець із паличкою, за свою схожість із ним. Коли ціна росте й графік вже намалював один держак із трикутничком, й на підході формується другий, то із великою ймовірністю буде продовження.
Одинарна вершина, ніби літера 'W', тільки крайні лінії десь на дві третіх чи половину нижче від максимуму Центрального шпилю.
Подвійна вершина, відрізняється від одинарної двома точками дотику до горизонтальної лінії опору (чи близько до неї). Бува, схожа на літеру М й характеризується розворотом або глибокою корекцією. Що протипоказано для покупок, бо часто призводить до падіння ціни.
Якщо говорити про вплив на торгові стратегії з боку, то вони будуть лише умовами для входу чи виходу із позицій. Адже параметри прописуються чи вже готові. Що значить, що вони беруться заздалегідь, якщо базуються на графічних патернах або включають як один із компонентів.
Хоча може бути й інша ситуація, коли патерни не використовуються, проте виявивши їх під час аналізу, треба розглянути ситуації детальніше.
Трейдер не бере до уваги ніякий аналіз, просто робить торгові угоди як йому заманеться. Без чітких умов входу та виходу, щоб було на що орієнтуватись. В кращому випадку, така діяльність призведе до недоотримання прибутку. Коли буває запас ходу й хороші технічні сигнали, але виходи завчасні. Або угоди можуть виходити в нуль чи з невеликим мінусом, через стягнення комісій. Зазвичай така торгівля не веде до втішних результатів, бо аналіз відсутній як такий.
Є об'єктивні дані ринкової ситуації. Технічний аналіз дозволяє використати індикатори та графічні патерни. Це прописано у стратегії. Настає умова для входу:
+ подвійне дно, на сильній підтримці;
+ зміна низхідного тренду на висхідний, перетином трендової лінії опору;
+ Ковзаюча Середня із періодом 14 перетнула старшу 50-ту знизу вгору.
Ситуація значно сприятливіша і маючи розмір фігури дна, як-то w, можна визначити пропорційну точку виходу. Тобто від 100% закласти десь 75% для тейк пофіту.
Трейдер регулярно використовує технічний аналіз для прийняття рішень, та використання цілей. Зростає ефективність та систематичність дій, а головне обґрунтованих. Капітал в такому випадку, із оптимістичним прогнозом, зростає на більш-менш хороший відсоток. Або принаймні дає торгувати в плюс, що теж добре.
Торговий інструмент: STEEM/USDT або будь-який інший.
Період часу: мультитайфрейм (чим вищий, тим сильніший сигнал).
Інструменти аналізу:
+ Лінії опору та підтримки;
+ Графічні патерни;
+ Bolinger Bands - для визначення тренду та кращого орієнтування;
+ MACD - для підсилення розворотів чи підтвердження продовження руху, шляхом виявлення дивергенції.
Концепція стратегії:
На графік наносяться важливі лінії опору та підтримки, в тому числі трендові й похилі, які можуть формувати канали. Вивчаються графічні малюнки, які можуть бути поблизу важливих рівнів. Враховується їх положення відносно тренду, якщо виявлено. Додатково перевіряється наявність дивергенції, щоб посилити сигнал. А на основі Ліній Болінджера та розміру фігури, розраховується рівні стоп лосу та тейкрофіту, від яких вже закладено допустимий ризик на одну угоду.
Дивергенція ціна на графіку знижується, а MACD зростає. Фігура "ГіП", слабенька, але є. Біткоїн зріс у ціні.
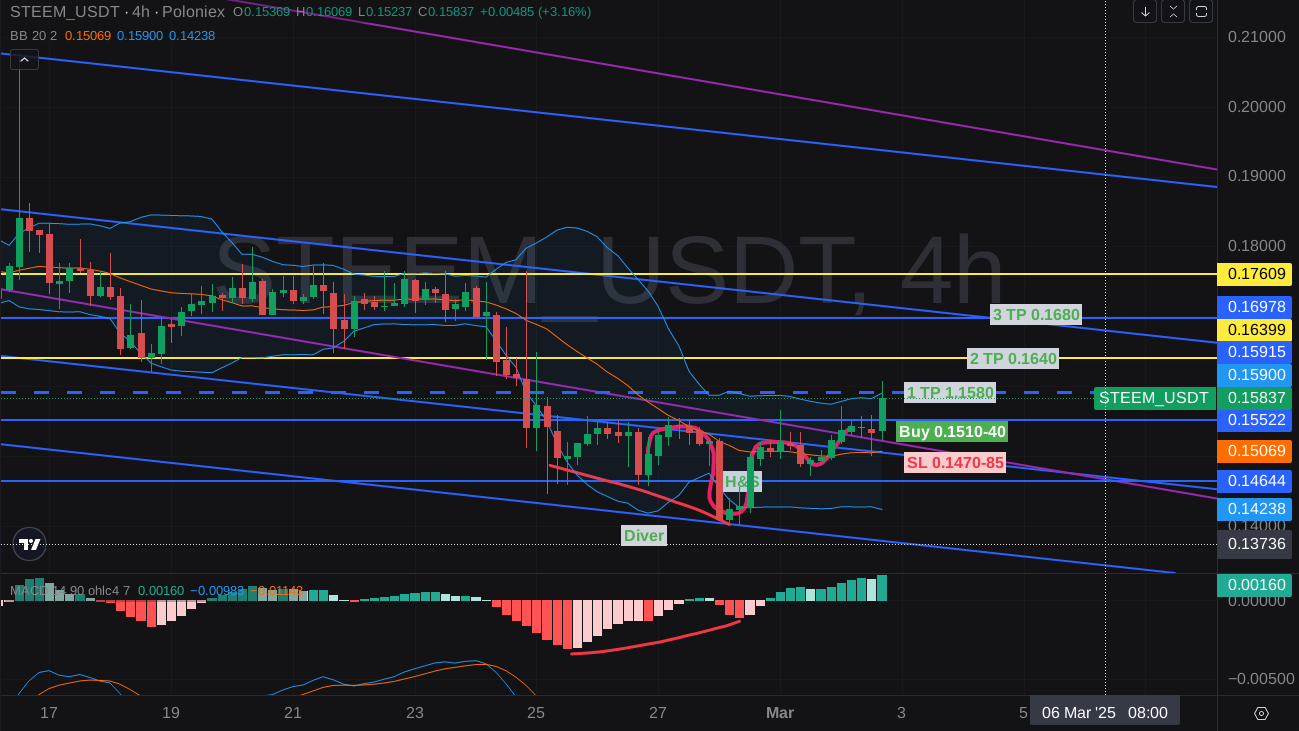
Вхід: 0.1510-40 (орієнтовно)
TP: 0.1580 (також можна розглянути другий та третій варіанти)
SL:0.1470-85 (десь на правому плечі або нижче нього).
Розвортна подвійна вершина 'M', правий бік якої має також і "ГіП", праве плече якої заходить на низхідний тренд. Підкріпляється зниження заходом в положення середня-нижня Лінія Болінджера. Потім пробиття підтримки 0.1760 і повторний її тест, що досить добре для продажу.
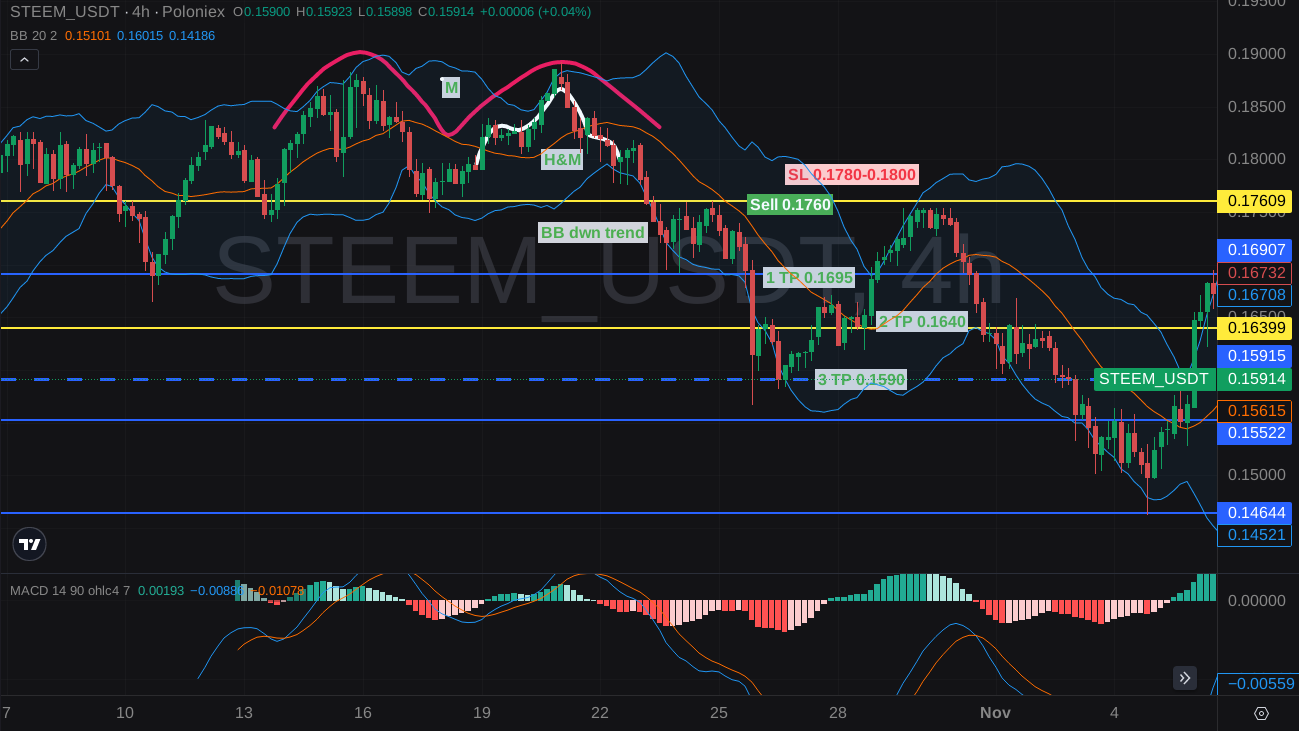
Продаж: 0.1760 (найкраще після повторного тесту, але починаючи із правого плеча теж був хороший шанс).
TP: 0.1695 (також можна розглянути другий та третій варіанти)
SL:0.1780-0.1800 (десь на правому плечі або нижче нього).
Розрахунок ризиків відповідно до можливостей депозиту та стилю торгівлі. В класичному варіанті це 1-3% на одну угоду.
Матеріал представлений для ознайомлення й не гарантує прибутку, як і не закликає виконувати якісь вказівки стосовно торгових дій. Торгівля на фінансових ринках має високий ризик для капіталу, тому всі Ваші дії виключно лише особиста відповідальність
Використані ресурси та матеріали, котрі можуть бути корисні
1. Знімки екрану взяті із сайту криптобіржі Poloniex.
2. Дописи на пов'язані із темою:
+ Ризики - https://steemit.com/steemitcryptoacademy/@luxalok/dynamic-risk-management-in-crypto-trading-ua-en
+ Дивергенція - https://steemit.com/steemitcryptoacademy/@luxalok/advanced-technical-analysis-with-divergence-trading-ua-en
+ Лінії Болінджера - https://steemit.com/steemitcryptoacademy/@luxalok/mastering-steem-market-volatility-using-bollinger-bands-ua-en
| EN translated by AI |
|---|
Technical Analysis (TA) in cryptocurrency trading serves the same purpose as it does elsewhere. It allows for assessing the situation and making decisions without requiring extensive in-depth knowledge. By focusing on key features, expressed visually and technically, you can make successful trading decisions. Even seasoned professionals acknowledge that simplicity is often superior.
The core principles of TA are its ease of understanding and application, despite the seemingly complex mechanisms. These can be divided into two types:
+ Indicators: based on mathematical calculations and various objective data, such as MACD or Moving Averages;
+ Chart patterns: ranging from simple support and resistance lines and trendlines, to various chart patterns. The latter are consistent combinations from several candlesticks as in "Price Action", to much larger structures, such as "Head and Shoulders" (H&S), "Bearish Ears," and others.
Trends have three directions:
+ Uptrend: price increases towards the upper right corner of the chart. Higher highs and higher lows. The angle of inclination, for a good one, should be around 45 degrees. Good for buying and holding positions to let profits grow.
+ Downtrend: price decreases towards the lower right corner. Lower highs and lower lows. Good for selling on futures and other instruments that allow you to profit when the value falls.
+ Sideways (range or flat): the price moves in a horizontal channel without a clear direction. Often, after bouncing from the top, it heads to the bottom, and so on for an indefinite period. Depending on the strength and position, it can be considered for temporary trading - buy or sell.
Levels are one of the simplest representations of important psychological and heavily traded areas from which the price is more likely to bounce.
They can be divided into:
- Horizontal: can maintain their strength for a long time, depending on the historical-psychological significance;
- Inclined: lines at a certain angle of inclination, which is often a sign of a bearish or bullish trend. A break or pronounced consolidation below them may indicate a change in trend or a transition to flat;
- Dynamic: formed over a certain period of time, for example, if it is a Moving Average, the line will change position during active trading.
Human psychology exhibits repetitive behavior, which is also characteristic of trading in financial markets. The trading process, which is reflected in the chart of a trading instrument, has acquired certain characteristics. These characteristics are embodied in certain "drawings" of candlesticks or bars. That is, they have become similar to familiar geometric figures or other models that can be recognized by viewing historical data. There are many of them, from simple to complex. However, we can consider the most recognizable ones as an example:
1. "Head and Shoulders" (H&S) - similar to a human figure.
2. "Double Top" - popularly known as "Bearish Ears."
Both are characteristic harbingers of a decrease in value, although they do not guarantee it.
They also have their opposite reflections:
+ Inverted "H&S" - head at the bottom, and shoulders above it.
+ "Double Bottom" - the price touches the support twice and goes higher.
And these already suggest growth.
Indicators give us quick access to statistical data. Having repeatability, they can be used for trading. For example, Bollinger Bands are a Moving Average with a larger set of parameters, where there are two more lines, offset upward and downward. Providing a semblance of a channel. This provides both the opportunity to assess the direction of the trend by the price movement between the lines:
+ Uptrend - middle-upper;
+ Downtrend - middle-lower;
+ Sideways - upper-lower.
Also, to have dynamic resistance and support levels, not guaranteed, but already better reference points than guessing.
Example. The price has repeatedly covered the distance between the Bollinger Bands "upper-lower" in the price channel 0.14-0.18 STEEM/USDT. So, the next approach to the lower one, as support, can already be used as a guide for buying at 0.14. And the middle or upper lines of the indicator, as exit points at 0.1550 or 0.1750, they are also targets for take profit.
The most common patterns, in themselves, are not decisive in trends, because their strength and position are also important. This means that in a small time period, they can only cover a short distance or signal the beginning of a larger movement. However, on older time frames, they will not be effective and will not give the desired result.
Triangles are characterized by accumulation that gradually shrinks, that is, the tension of the confrontation between both sides - sellers and buyers, increases, and a breakthrough in one of the sides results in a good price jump.
They also prove to be good as confirmation of the continuation of the trend. And they are called a pennant, that is, a triangular flag with a stick, for their similarity to it. When the price is growing and the chart has already drawn one flag pole with a triangle, and the second one is forming on the approach, then with a high probability there will be a continuation.
A single peak, like the letter 'W', only the extreme lines are about two-thirds or half lower than the maximum of the Central spire.
A double top differs from a single one in two points of contact with the horizontal resistance line (or close to it). It is often similar to the letter M and is characterized by a reversal or deep correction. What is contraindicated for purchases, because it often leads to a drop in price.
If we talk about the impact on trading strategies from the side, then they will only be conditions for entering or exiting positions. After all, the parameters are written or already ready. Which means that they are taken in advance if they are based on chart patterns or include as one of the components.
Although there may be another situation, when patterns are not used, but having discovered them during the analysis, it is necessary to consider the situations in more detail.
A trader does not take into account any analysis, just makes trades as he pleases. Without clear conditions of entry and exit, so that there is something to focus on. In the best case, such activity will lead to under-receiving profit. When there is a margin of progress and good technical signals, but exits are premature. Or deals may go to zero or with a slight minus, due to the collection of commissions. Usually, such trading does not lead to encouraging results, because there is no analysis as such.
There is objective data on the market situation. Technical analysis allows you to use indicators and chart patterns. This is spelled out in the strategy. The condition for entry arrives:
+ double bottom, on strong support;
+ change of downtrend to uptrend, by crossing the trend line of resistance;
+ Moving Average with a period of 14 crossed the older 50th from the bottom up.
The situation is much more favorable and having the size of the bottom figure, like w, you can determine the proportional exit point. That is, to lay from 100% somewhere 75% for take profit.
The trader regularly uses technical analysis for decision-making and the use of goals. The efficiency and consistency of actions, and most importantly, justified, increase. Capital in this case, with an optimistic forecast, grows by a more or less good percentage. Or at least allows you to trade in the black, which is also good.
Trading instrument: STEEM/USDT or any other.
Time period: multi-timeframe (the higher, the stronger the signal).
Analysis tools:
+ Resistance and support lines;
+ Chart patterns;
+ Bolinger Bands - to determine the trend and better orientation;
+ MACD - to enhance reversals or confirm the continuation of movement, by identifying divergence.
Strategy concept:
Important resistance and support lines are plotted on the chart, including trend and inclined ones, which can form channels. Chart drawings that may be near important levels are studied. Their position relative to the trend is taken into account, if detected. Additionally, the presence of divergence is checked to enhance the signal. And on the basis of Bolinger Bands and the size of the figure, the levels of stop loss and take profit are calculated, from which the permissible risk per trade is already laid down.
Divergence: the price on the chart is decreasing, and the MACD is increasing. The figure "H&S", weak, but there is. Bitcoin rose in price.
Entry: 0.1510-40 (approximately)
TP: 0.1580 (you can also consider the second and third options)
SL: 0.1470-85 (somewhere on the right shoulder or below it).
Reversal double top 'M', the right side of which also has "H&S", the right shoulder of which goes to the downtrend. It is reinforced by a decrease in the entry into the position of the middle-lower Bollinger Line. Then breaking the support of 0.1760 and retesting it, which is quite good for selling.
Sale: 0.1760 (best after retesting, but starting from the right shoulder was also a good chance).
TP: 0.1695 (you can also consider the second and third options)
SL: 0.1780-0.1800 (somewhere on the right shoulder or below it).
Risk calculation according to the possibilities of the deposit and trading style. In the classic version, it is 1-3% per trade.
The material is presented for informational purposes and does not guarantee profit, nor does it encourage you to follow any instructions regarding trading actions. Trading in financial markets has a high risk for capital, so all your actions are solely your personal responsibility
Used resources and materials that may be useful
1. Screenshots taken from the Poloniex crypto exchange website.
2. Posts on related to the topic:
+ Risks - https://steemit.com/steemitcryptoacademy/@luxalok/dynamic-risk-management-in-crypto-trading-ua-en
+ Divergence - https://steemit.com/steemitcryptoacademy/@luxalok/advanced-technical-analysis-with-divergence-trading-ua-en
+ Bollinger Bands - https://steemit.com/steemitcryptoacademy/@luxalok/mastering-steem-market-volatility-using-bollinger-bands-ua-en