Книга замовлень у трейдингу – це не меню зі стравами, а записи про реальні очікування учасників. Це означає, що там показано відкладені угоди, які чекають на виконання, але не гарантовано, що будуть опрацьовані на ринку.
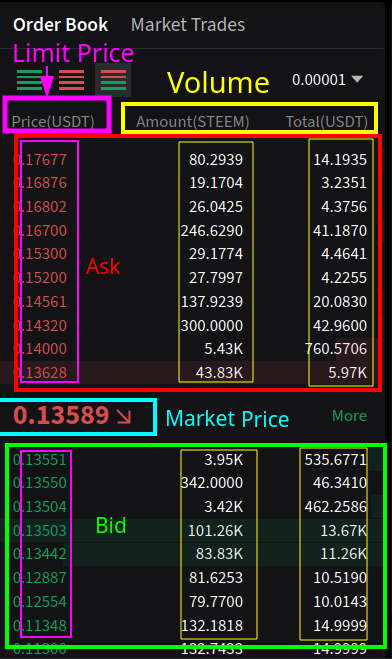
Цю книгу ще називають біржовим стаканом, де детально показано кількість обсягів для кожної позначки. А їхнє розміщення за шкалою є глибиною ринку.
Візуально це два поля, поділені актуальною вартістю активу, на дві половини цінових груп:
Різниця між Bid та Ask називається спредом. Зазвичай майже повна його відсутність свідчить про високу ліквідність, яка може бути різною на окремих криптобіржах. Наприклад, на Poloniex більший обсяг щоденних торгів, але спред динамічно змінюється. Деякі інструменти з низьким оборотом обсягу взагалі можуть мати розрив у 0.50 USDT. На це треба зважати.
У ручному режимі можна перемикати відображення кількості символів після крапки. Що менше, то узагальненіший результат. Що більше, то дрібніша деталізація і настрій до мікрозмін.
Такий підхід надає уявлення про реальні очікування, тобто майбутнє. Тоді як технічний аналіз переважно базується на історії вже виконаних угод, однак певною мірою методологія трохи до нього зводиться. Адже рівні підтримки та опору можуть наноситися у візуальному вигляді. Хоча для автоматизованої торгівлі братимуться вже інші показники.
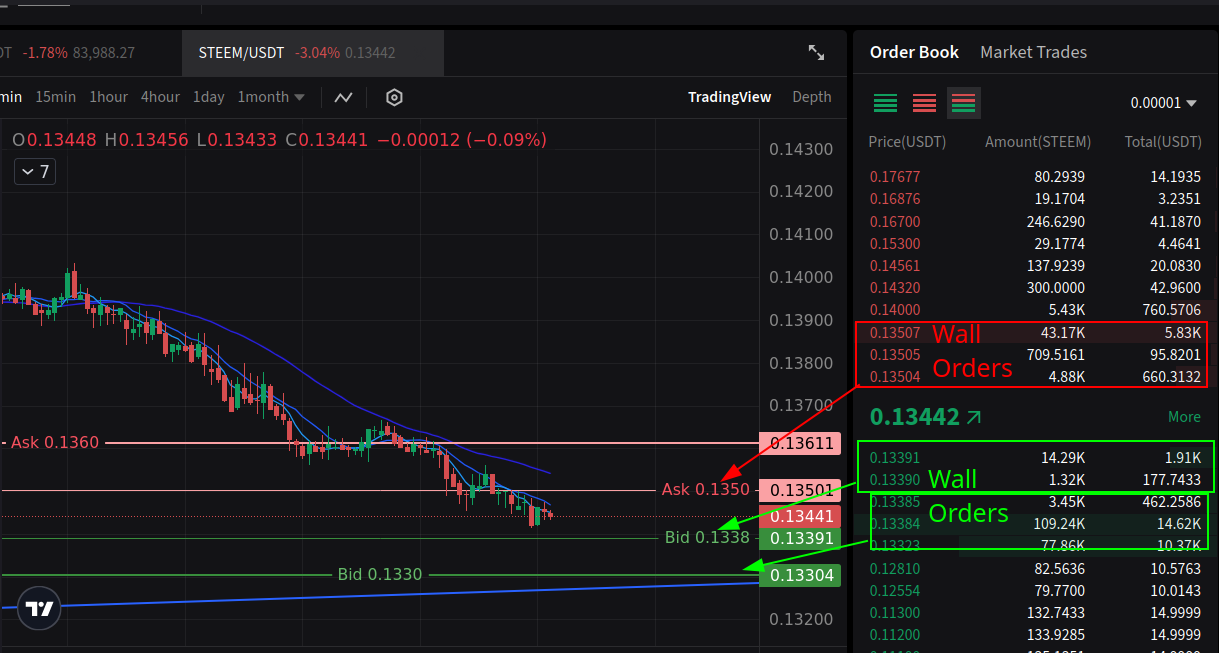
Споглядаючи надану інформацію, трейдери можуть оцінювати стан криптовалютної пари та робити орієнтовні прогнози руху. Деякі цінові рівні можуть мати великі обсяги з певною кількістю очікуваних ордерів. Окрім того, це може бути ціла ділянка, яка добре укріплена тісним розташуванням заявок на вертикальній шкалі одна біля одної. Подібне явище називають Стіною Ордерів, яку важко подолати або, пробивши, легко помчати далі.
STEEM/USDT має в біржовому стакані, за градацією 0.001, підтримку 0.1330 та опір 0.1360. Підтримка значно сильніша, а ціна між ними.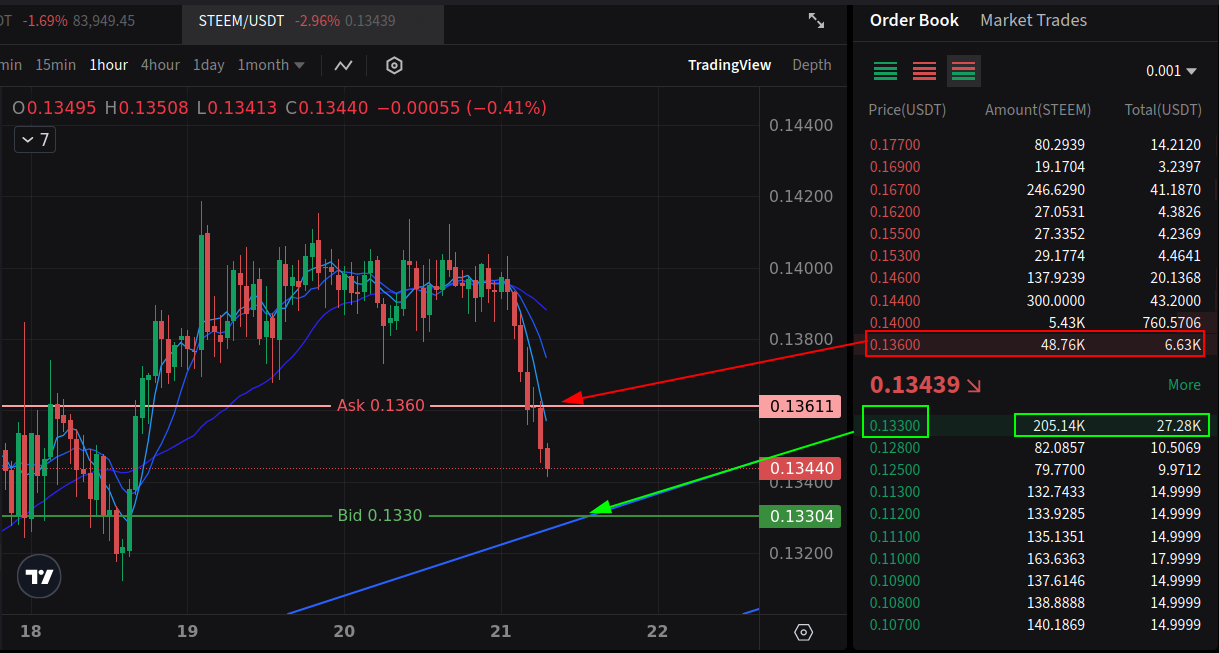
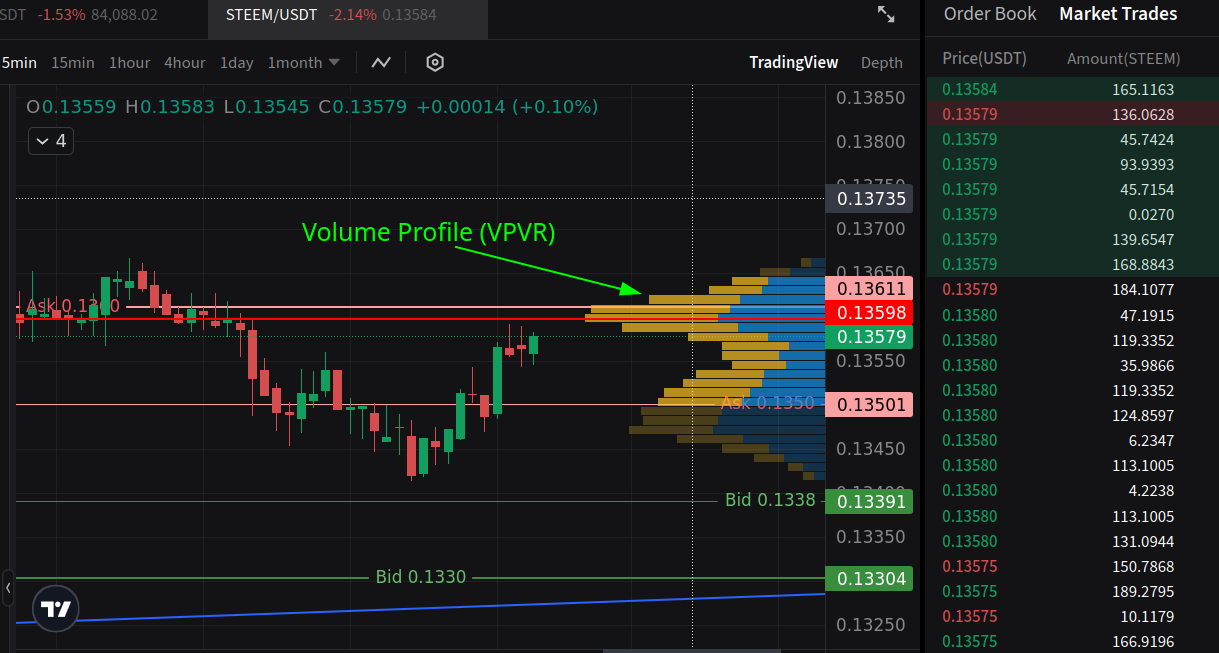
Перемикаємо на градацію 0.00001, щоб детальніше розглянути. Де маємо цілу стіну ордерів:
Пройти нижче не виходить, бо є сильна підтримка, тож вартість STEEM підскакує, але зіштовхується з тиском продавців, трішки відступає, але імпульсом дістає далі, бо вже немає в заявках очікувань опору 0.1360. Він динамічно змінюється учасниками або, виконуючись, впливає на зниження STEEM.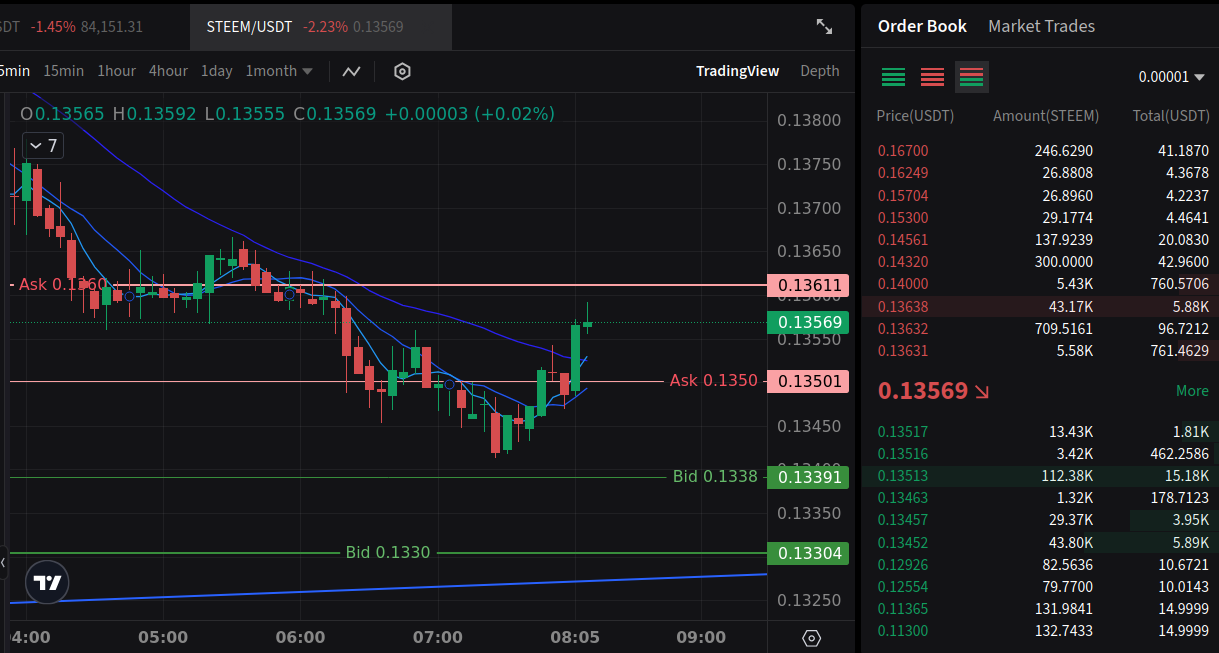
Висновок такий, що книга ордерів нічого не гарантує, а заявки можуть і зникнути, бо хтось передумав. Є інші випадки, коли подібний механізм використовують для різних маніпуляцій. Кошти хоч і резервуються, але на ринок не заходять, тільки підкріплюють намір. Тому треба звертати увагу на обсяги ордерів та частоту їхньої зміни й порівнювати з реальним виконанням у загальному потоці.
До аналізу загального Потоку Ордерів можна віднести комплексне охоплення даних з Order Book та Market Trades. Тобто вже реально виконаних угод чи відкритих. Залежно від типу торгових інструментів: спот, ф'ючерси тощо.
Market Trades має загальний масив, де містяться і покупки, і продажі, лише позначені кольором. Тож для швидкого сортування підходить індикатор Volume Profile (VPVR). Де видно силу опору 0.1360 на лінії POC.
Доки робилися записи, ціна знизилася до 0.1345. Де є збіг реальних торгів із Книгою Ордерів.
__
А вже наступного дня ціна підскочила ще вище, торкнувшись 0.1390. Одна з причин – сильні підтримки, як можна побачити раніше. І слабший опір. Також помітна динамічна зміна підтримок Bid з 0.1330-40 вже до 0.1350-60.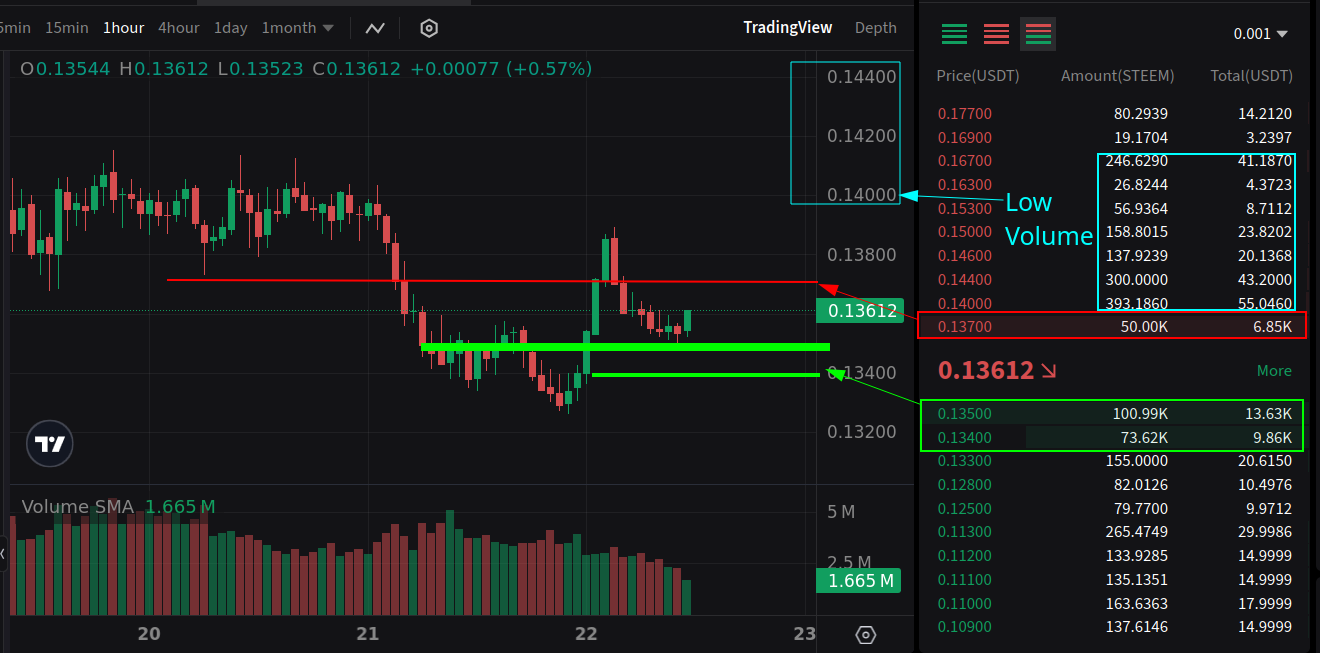
Подекуди криптобіржі надають додаткові відомості, як-от угоди китів, котрі відображаються в окремому табло. Однак, щоб бачити весь Потік Ордерів, потрібно скористатися спеціалізованими торговими терміналами, які можуть не постачатися криптобіржею й підключатися до неї через API. Тоді в торговому терміналі буде значно більше потрібної інформації в реальному часі – зручно відсортованої. З нюансів: це переважно версії для ПК, і потужність та наявність оперативної пам'яті має бути в певному достатку. А також вони можуть бути платними.
Ще один варіант – це сторонні сервіси. Наприклад, вільний доступ до безоплатного ознайомлення на платформі ExoCharts дає хоч уявлення про структуру даних.
Знімок екрана з exocharts.com LTCUSDT ф'ючерс Binance
Розміщення чи виконання великих угод не так просто відстежити, але й не так важко. По-перше, вони можуть маскуватися під дрібніші, розділені на декілька штук, щоб не бути дуже помітними. По-друге, до їхнього сприйняття в потоці даних треба звикнути.
Базові інструменти на криптобіржах переважно пропонують спостереження в реальному часі, без якихось особливостей та фільтрації. Хоча такі індикатори, як Volume Profile, показують краще сортування виконаних угод, то лімітні залишається хіба що споглядати в Книзі Ордерів. Тож у звичайному режимі можливостей це хіба що можна помітити в процесі або коли обсяг уже завантажено на конкретні рівні. Де він суттєво виділяється.
За умови торгів на надійній криптобіржі й достатньому пильнуванні подій, великі угоди можуть сигналізувати про зміну або посилення тренду.
Наприклад, як згадувалося раніше стосовно STEEM/USDT, коли в Книзі Ордерів були сильні підтримки в області 0.1332-0.1339. Подібне можна теж вважати чимось великим, бо глибина ринку невелика. І тоді ціна від них відштовхувалася. Так само на споті, коли купуються великі обсяги криптовалюти й виводяться на холодні гаманці, то це розцінюється як очікування на зростання, але середньо- чи довгострокове. Хоча для цього ще треба стежити за onchain-data.
Інший випадок, коли на одну ціну чи поряд є багато ліміток, а тренд висхідний. Це може бути ознакою його розвороту або сильнішої стимуляції рухатися вище.
Фіксація є ще одним сигналом. Коли йдуть великі кількості продажів, особливо на максимумах, то ймовірне різке падіння, якщо це все не буде активно поглинатися покупцями. Аналогічно з покупками на мінімумах.
Загалом, у будь-якому разі великі ордери китів (які сильно виділяються) чи масивні скупчення можуть сповіщати про швидкі зміни на ринку. Головне – дотримуватися встановлених ризиків і користуватися стоп-лосом.
Хоча може бути й урівноваження позицій, тоді ціна піде не відразу, а коливатиметься в боковому каналі.
Інструменти, налаштування усталені, як є після додавання на графік від постачальника TradingView:
Торгові налаштування (Trading Setup):
Стратегія:
1. Визначення загального тренду на старших періодах D1, H4, H1, а потім на дрібніших, як-от M15-M1:
2. Рівні підтримки та опору:
2. Пошук точок входу:
Лонг (Купівля):
Шорт (Продаж):
3. Управління ризиками:
4. Вихід з угоди:
Приклад угоди (Лонг):
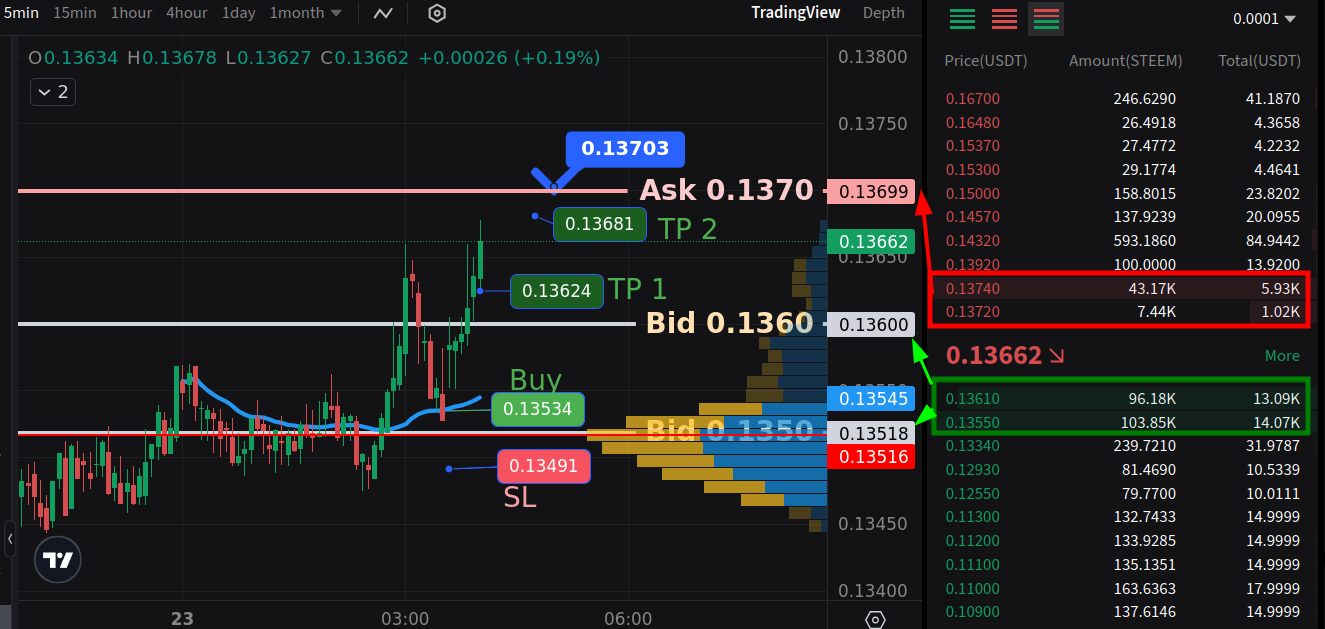
На зображенні в біржовому стакані Bid відрізняється від зазначених у вході та графічних горизонтальних рівнях. Це тому, що ситуація динамічно змінюється як новими заявками, так і їхнім виконанням.
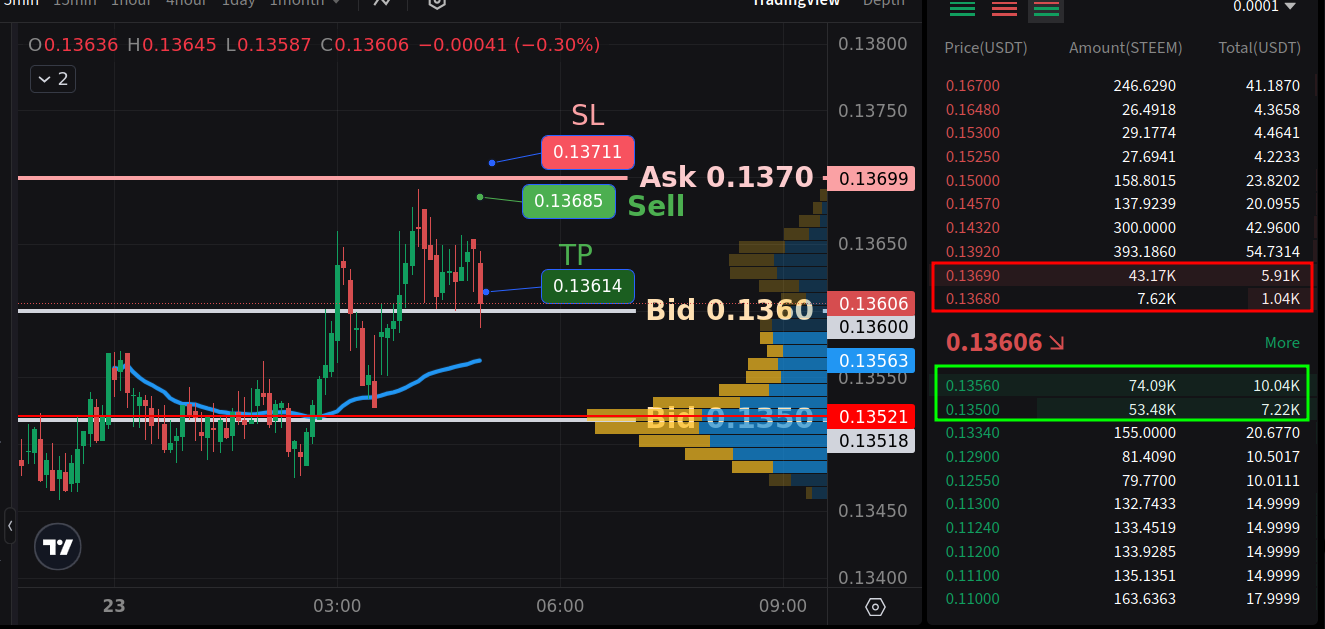
Приклад угоди (Шорт) слабший:
Від опору 0.1370 до підтримки 0.1360.
Sell: 0.13685
TP: 0.13615
SL: 0.13711
День: Понеділок, звичайний торговий день.
Криптовалюта: STEEM/USDT.
Трейдер: Алекс, досвідчений скальпер, який торгує на основі Order Flow та Volume Profile.
Початок дня:
Алекс відкриває свій торговий термінал. Він починає з аналізу старших таймфреймів (D1, H4, H1) для визначення загального тренду STEEM/USDT. На денному графіку ціна перебуває у висхідному каналі, але на H4 і H1 видно, що ціна нещодавно відбилася від верхньої межі каналу і зараз перебуває у фазі корекції. WVAP на H1 знаходиться нижче за ціну, що вказує на локальний ведмежий тренд.
Переходячи на 5-хвилинний та 1-хвилинний графіки, Алекс бачить, що ціна наближається до важливого рівня підтримки, який сформований:
Угода 1 (Лонг): Успіх
Аналіз: Угода була успішною завдяки чіткому визначенню рівня підтримки (Order Book, Volume Profile), підтвердженню покупцями (стрічка угод) та дотриманню правил ризик-менеджменту (короткий стоп-лос, фіксація прибутку частинами).
Угода 2 (Шорт): (Маніпуляція)
Аналіз: Незважаючи на правильний аналіз (опір, продажі), угода виявилася збитковою через маніпуляцію ринком. Проте завдяки суворому дотриманню правил ризик-менеджменту (короткий стоп-лос, обмежений розмір позиції) збиток був мінімальним і не вплинув суттєво на депозит Алекса.
Угода 3 (Лонг): Успіх (відновлення)
Аналіз: Після аналізу попередньої невдачі, відновлення торгівлі, повернення ціни та підтвердження Order Book дали змогу увійти в угоду та забрати профіт.
Підсумки дня:
Висновок:
Попередження
Матеріал розміщено для ознайомлення. Тому він не є гарантією отримання прибутку. Торгівля на фінансових ринках є дуже ризикованою.
Використані ресурси та джерела:
| EN translated by AI |
|---|
The order book in trading is not a menu of dishes, but rather a record of the real expectations of market participants. This means that it shows pending orders that are waiting to be executed, but there is no guarantee that they will be processed in the market.
This book is also called the market depth chart (or simply "the book"), where the quantity of volume for each price level is shown in detail. Their placement on the scale represents the market depth.
Visually, it consists of two columns divided by the current asset value into two halves of price groups:
The difference between the Bid and Ask prices is called the spread. Usually, its near absence indicates high liquidity, which can vary across different cryptocurrency exchanges. For example, Poloniex has a larger daily trading volume, but the spread fluctuates dynamically. Some instruments with low trading volume may even have a gap of 0.50 USDT. This is something to watch out for.
In manual mode, you can switch the display of the number of decimal places. Fewer decimal places provide a more generalized result. More decimal places show finer detail and sentiment towards micro-changes.
This approach provides insight into real expectations, i.e., the future. While technical analysis is primarily based on the history of executed trades, to some extent, the methodology converges with it slightly. This is because support and resistance levels can be plotted visually. However, for automated trading, other indicators will be used.
By observing the provided information, traders can assess the state of the cryptocurrency pair and make tentative movement forecasts. Some price levels may have large volumes with a certain number of pending orders. Moreover, it can be an entire area that is well-fortified by closely spaced orders on the vertical scale, one next to the other. This phenomenon is called an Order Wall, which is difficult to overcome, or, once broken, can lead to rapid price movement.
STEEM/USDT has support at 0.1330 and resistance at 0.1360 in the order book, with a gradation of 0.001. The support is significantly stronger, and the price is between them.
Switching to a gradation of 0.00001 for a more detailed view, we see a whole order wall:
Moving lower is not possible due to strong support, so the price of STEEM bounces up, but encounters selling pressure, retreats slightly, but then impulsively moves further because there are no longer expectations of resistance at 0.1360 in the orders. It dynamically changes by participants or by being executed, influencing the decrease of STEEM.
The conclusion is that the order book does not guarantee anything, and orders can disappear because someone changed their mind. There are other cases where a similar mechanism is used for various manipulations. Although funds are reserved, they do not enter the market, they only reinforce the intention. Therefore, it is necessary to pay attention to the volume of orders and the frequency of their changes and compare them with the actual execution in the overall flow.
The analysis of the overall Order Flow can include comprehensive coverage of data from the Order Book and Market Trades. That is, trades that have already been executed or are open. Depending on the type of trading instruments: spot, futures, etc.
Market Trades has a general array that contains both buys and sells, only marked by color. Therefore, the Volume Profile (VPVR) indicator is suitable for quick sorting. Where you can see the strength of resistance at 0.1360 on the POC line.
While these notes were being made, the price dropped to 0.1345. Where there is a coincidence of real trades with the Order Book.
__
And the very next day, the price jumped even higher, touching 0.1390. One of the reasons is strong support levels, as can be seen earlier. And weaker resistance. Also noticeable is the dynamic change of Bid support from 0.1330-40 to 0.1350-60.
Some crypto exchanges provide additional information, such as whale trades, which are displayed in a separate panel. However, to see the entire Order Flow, you need to use specialized trading terminals, which may not be provided by the crypto exchange and connect to it via API. Then, the trading terminal will have significantly more necessary information in real-time – conveniently sorted. The nuances are that these are mostly PC versions, and the processing power and RAM availability must be sufficient. Also, they may be paid.
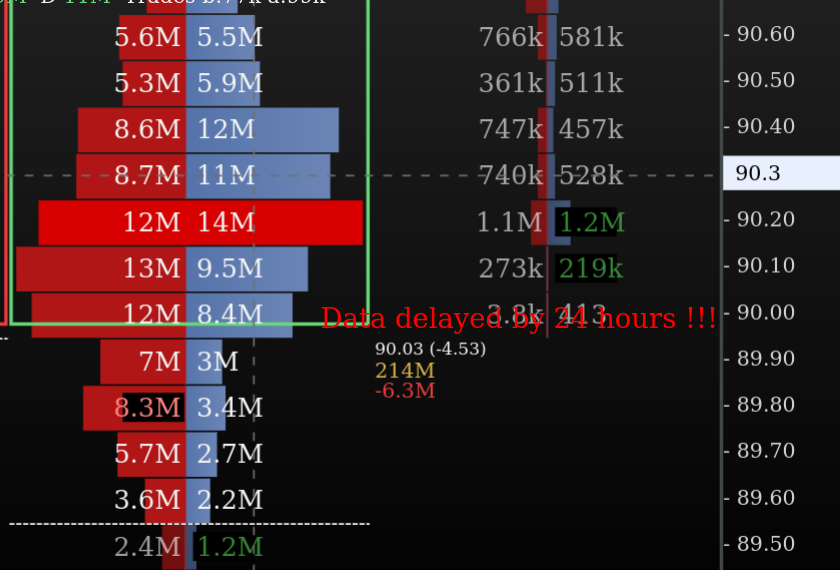
Another option is third-party services. For example, free access for a free trial on the ExoCharts platform gives at least an idea of the data structure.
Screenshot from exocharts.com LTCUSDT futures Binance
Placing or executing large orders is not so easy to track, but also not so difficult. First, they can be masked as smaller ones, divided into several parts, so as not to be very noticeable. Second, you need to get used to their perception in the data flow.
Basic tools on crypto exchanges mainly offer real-time observation, without any special features or filtering. Although indicators like Volume Profile show better sorting of executed trades, limit orders can only be observed in the Order Book. So, in the usual mode of capabilities, this can only be noticed in the process or when the volume has already been loaded onto specific levels. Where it stands out significantly.
Provided you are trading on a reliable crypto exchange and monitoring events sufficiently, large trades can signal a change or strengthening of the trend.
For example, as mentioned earlier regarding STEEM/USDT, when there were strong supports in the Order Book in the 0.1332-0.1339 area. This can also be considered something large because the market depth is not significant. And then the price bounced off them. Similarly, on the spot market, when large volumes of cryptocurrency are bought and transferred to cold wallets, this is assessed as an expectation of growth, but medium- or long-term. Although for this, you also need to monitor onchain-data.
Another case is when there are many limit orders at one price or nearby, and the trend is upward. This may be a sign of its reversal or stronger stimulation to move higher.
Fixing is another signal. When there are large amounts of sales, especially at the highs, a sharp drop is likely if all this is not actively absorbed by buyers. Similarly, with purchases at the lows.
In general, in any case, large whale orders (which stand out significantly) or massive accumulations can signal rapid changes in the market. The main thing is to adhere to the established risks and use a stop-loss.
Although there may also be a balancing of positions, then the price will not go immediately but will fluctuate in a sideways channel.
Tools, settings are default as they are after adding to the chart from the TradingView provider:
Trading Setup:
Strategy:
1. Determining the Overall Trend on Higher Timeframes D1, H4, H1, and then on Smaller Ones, such as M15-M1:
2. Support and Resistance Levels:
2. Finding Entry Points:
Long (Buy):
Short (Sell):
3. Risk Management:
4. Exiting the Trade:
Example Trade (Long):
In the image, the Bid in the order book differs from the ones mentioned in the entry and the graphical horizontal levels. This is because the situation changes dynamically with both new orders and their execution.
Example Trade (Short) Weaker:
From resistance 0.1370 to support 0.1360.
Sell: 0.13685
TP: 0.13615
SL: 0.13711
Day: Monday, a regular trading day.
Cryptocurrency: STEEM/USDT.
Trader: Alex, an experienced scalper who trades based on Order Flow and Volume Profile.
Start of the Day:
Alex opens his trading terminal. He starts by analyzing higher timeframes (D1, H4, H1) to determine the overall trend of STEEM/USDT. On the daily chart, the price is in an ascending channel, but on H4 and H1, it is visible that the price recently bounced off the upper boundary of the channel and is now in a correction phase. The WVAP on H1 is below the price, indicating a local bearish trend.
Moving to the 5-minute and 1-minute charts, Alex sees that the price is approaching an important support level, which is formed by:
Trade 1 (Long): Success
Analysis: The trade was successful due to the clear identification of the support level (Order Book, Volume Profile), confirmation by buyers (trade feed), and adherence to risk management rules (short stop-loss, partial profit-taking).
Trade 2 (Short): (Manipulation)
Analysis: Despite the correct analysis (resistance, sales), the trade turned out to be unprofitable due to market manipulation. However, thanks to strict adherence to risk management rules (short stop-loss, limited position size), the loss was minimal and did not significantly affect Alex's deposit.
Trade 3 (Long): Success (Recovery)
Analysis: After analyzing the previous failure, the resumption of trading, the return of the price, and the confirmation of the Order Book allowed entering the trade and taking profit.
End of Day Summary:
Conclusion:
Disclaimer
This material is provided for informational purposes only. Therefore, it is not a guarantee of profit. Trading in financial markets is very risky.
Used resources and sources: