Full moon is coming soon. We will see full mon 2 days later. It means possible price dump is coming soon for Bitcoin price.
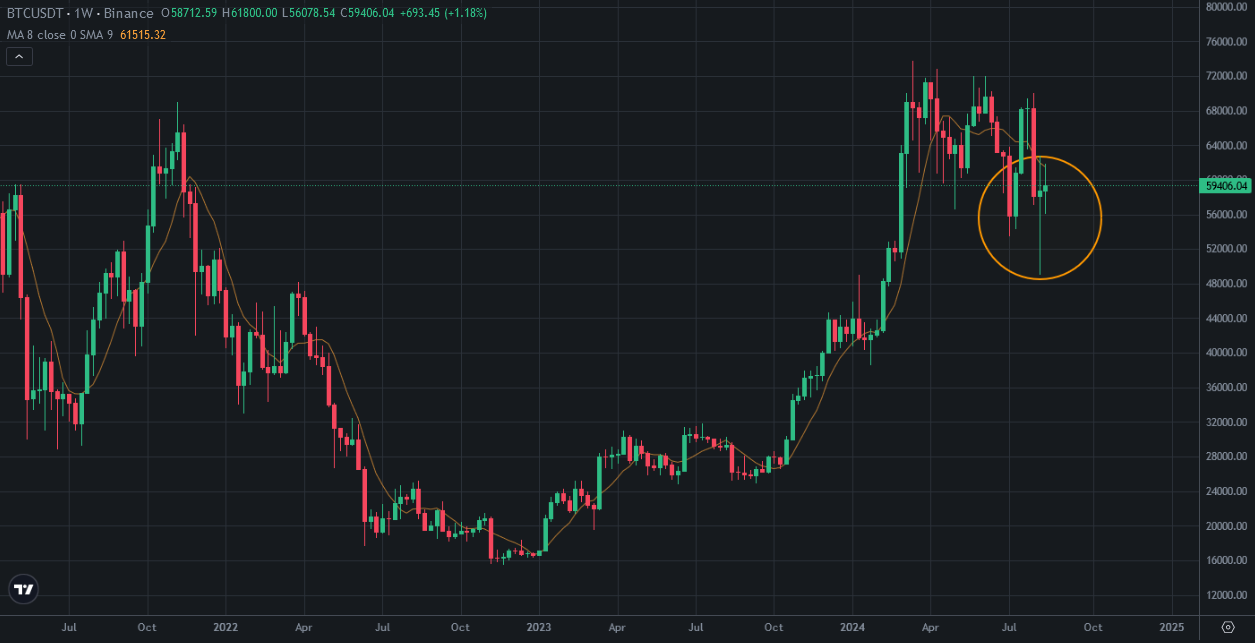
Here you can see weekly chart of Bitcoin. Bitcoin price chart has two green candles in last 2 weeks. We have not seen 3 green weekly candles after touching all time high. So, It is so possible to see red weekly candle in Bitcoin price chart.
Lunar Calendar is important for market maker. Next week will start with Full Moon. We may see red candle with the beginning of next week!
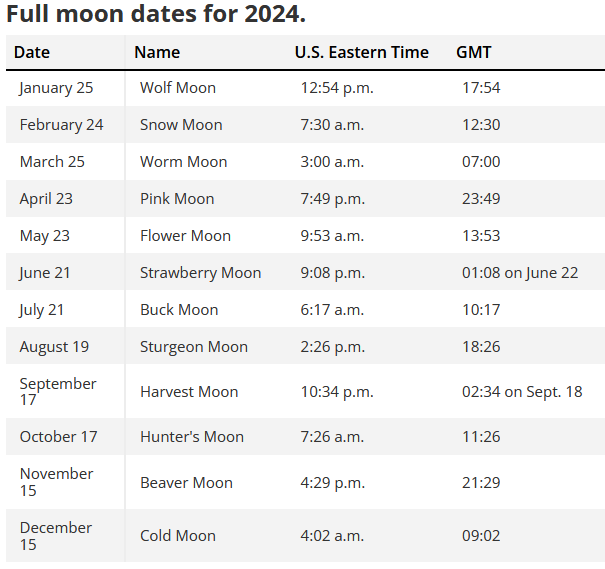
Here you can see the dates of full moon. You can check what happened at full moon. There are lots of astrological events at August. You saw what happened at August. August started with a market crash. So, Full Moon is one of important date for all markets!
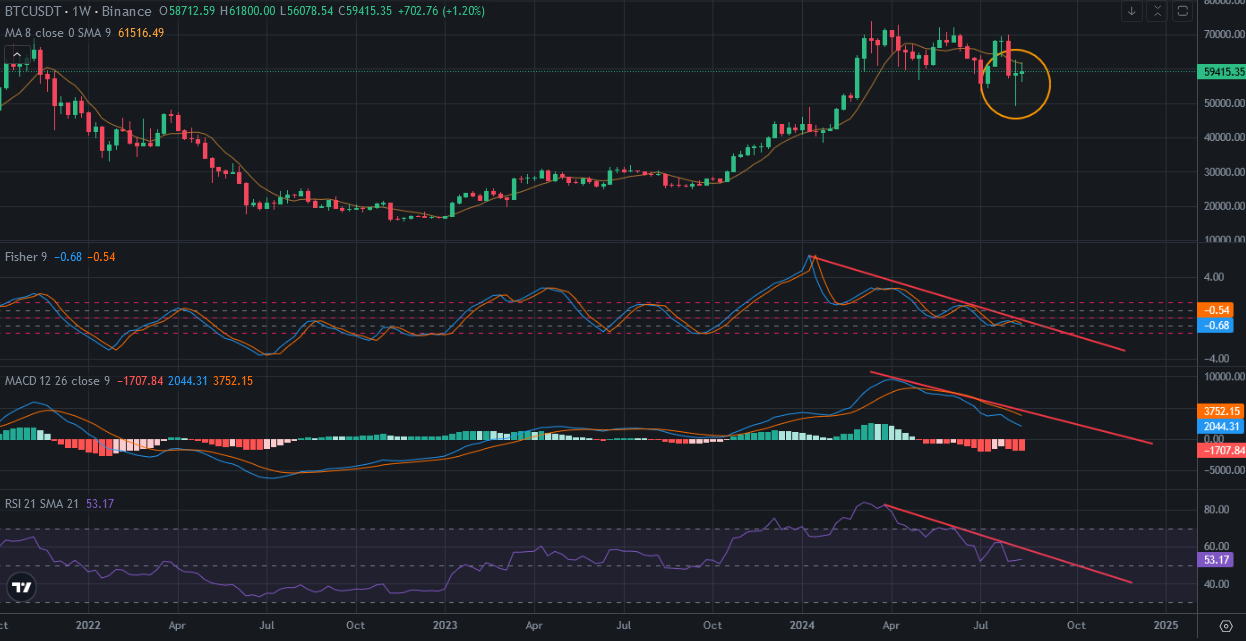
Here you can see the indicator weekly chart of Bitcoin. All Indicator resisted by downtrend lines. It will take long time to break up! It may be only a dream to see price pump pn Bitcoin in short time. Bitcoin needs a few weeks to reverse.
As I said, there is no 3 green weekly candles after all time high. If Bitcoin makes a green candle in next week, it will be the first time. I shared an analaysis to show you that it so impossible.
We will see..