There were lots of downtrend confirmation on Bitcoin price chart. There are 4 red daily candles on Bitcoin price chart in last 4 days. I shared lots of analysis about Bitcoin price chart said I was waiting for price dump.
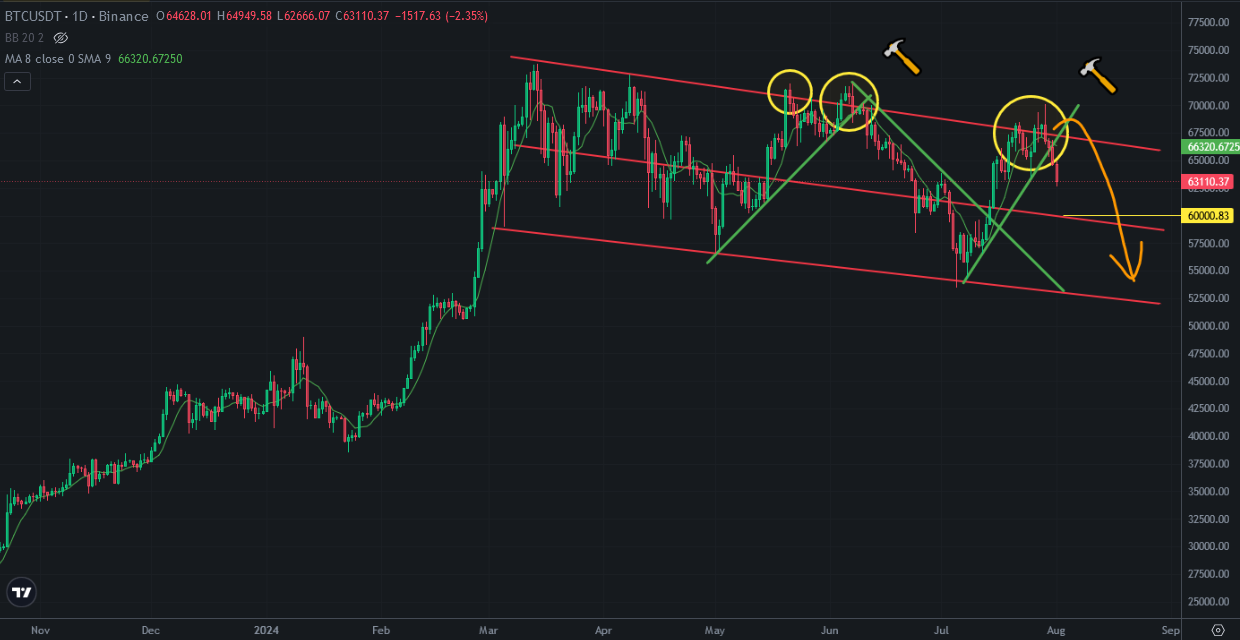
Here you can see daily chart of Bitcoin in my draft I shared it a few months ago. Bitcoin price broke down uptrend line and ready to go down to hit first target.
60K USD is the first price target for Bitcoin price. The middle line of descending channel is waiting for Bitcoin to touch. Bitcoin price stucked into this descending channel and It may be hard to escape from this channel. Because downtrend has started yet. I may take long time..
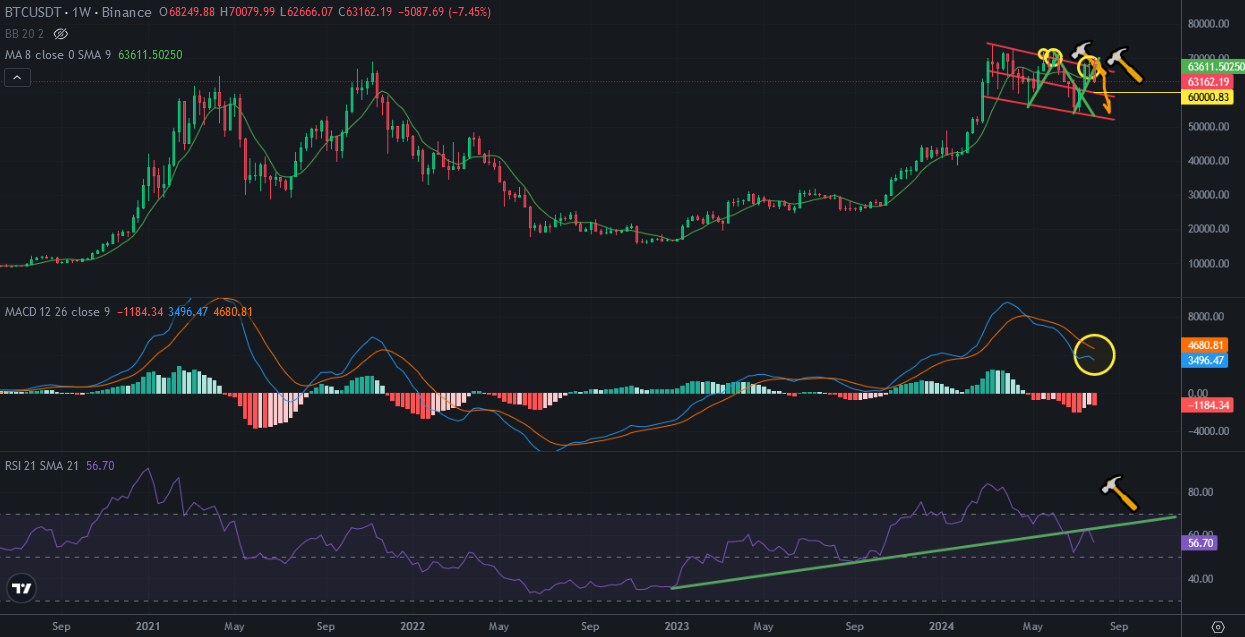
Here you can see weekly chart of Bitcoin. MACD Indicator is trying to go down after this weeks red candle. I said It would be very hard to reverse from this level.
There were great price drop confirmation on RSI Indicator and Bitcoin resisted by this uptrend line.
We need to see the new price pattern on Bitcoin price chart.
I will share the new pattern on Bitcoin price chart in a few weeks. I am following great bullish pattern. We need only a few weeks to be certain. I will also share you the date of bullish trend.
We will see!