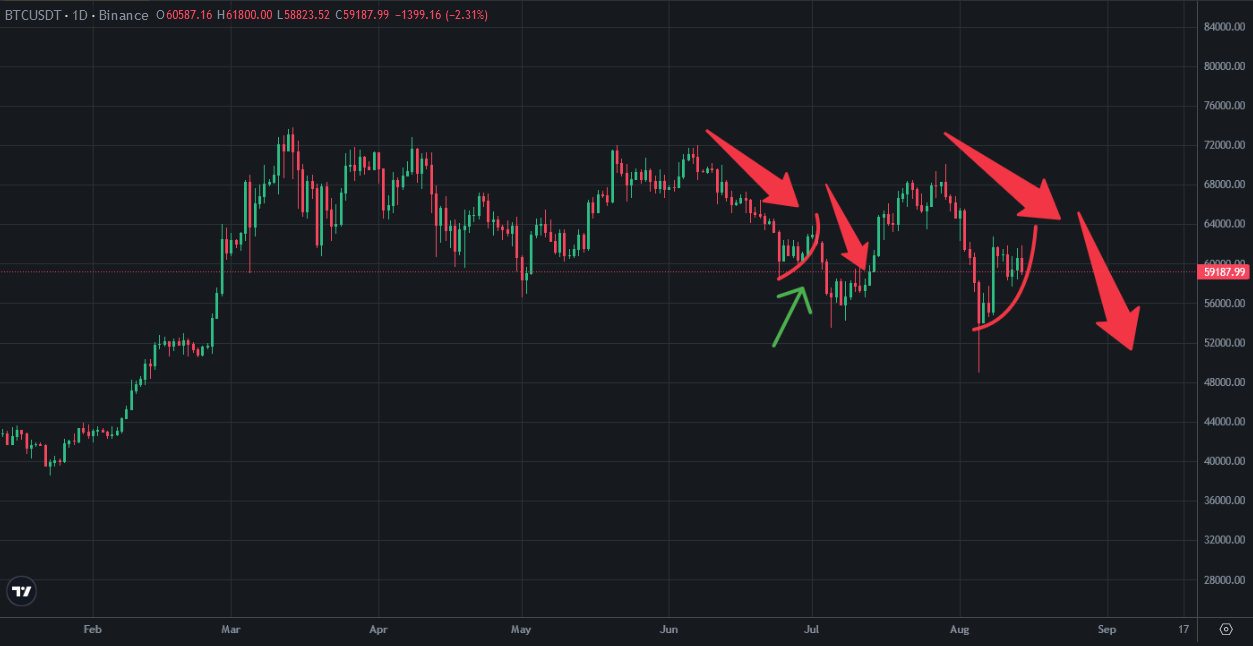
Bitcoin price was trying to get ready for bullish trap. I shared a few posts about bullish traps on bitcoin price chart. Here you can see daily chart of Bitcoin and there is a similarity between past and now. Bitcoin may go down when we look at the Bitcoin price chart. It was only a bullish trap from 47K to 62K bullish move.
Here you can see daily chart of Bitcoin. After making doji candle, Bitcoin price went up and went down again. Bitcoin may retest lower bottom again. Today Bitcoin price started to go down, It may be the beginning of bearish trap.
When we look at the indicators on daily chart of Bitcoin, I predited the possible fake move on MACD Indicator. It seemes as reversing from the bottom but It has not happened. We may see fake move and going down on MACD Indicator again.
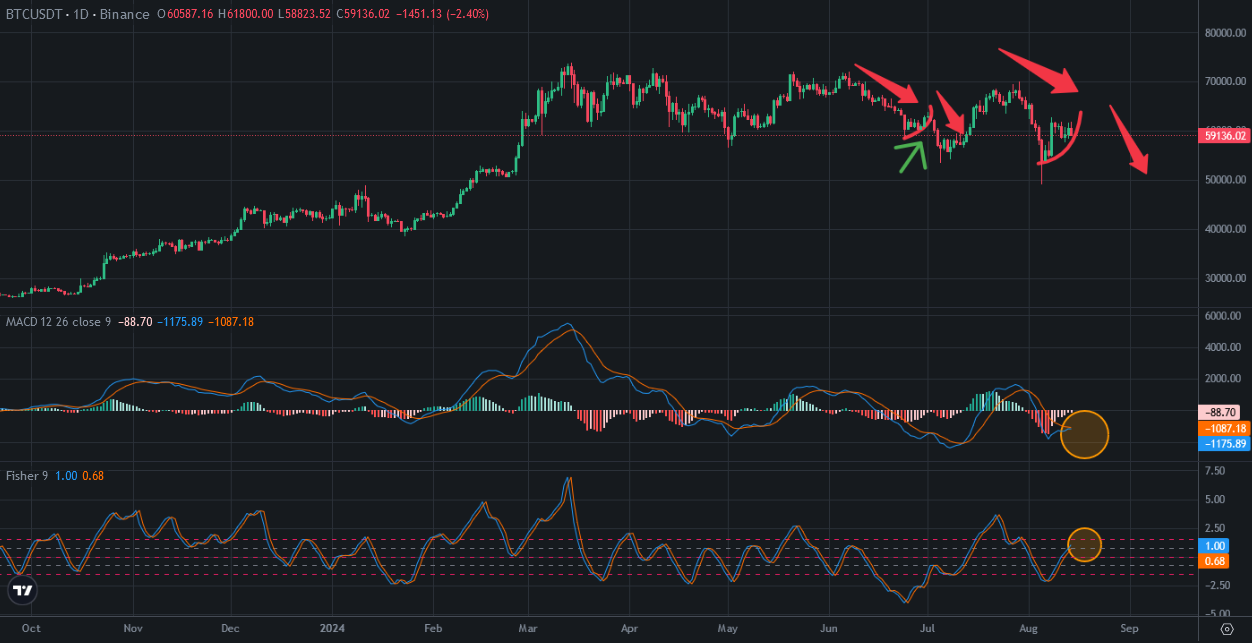
I shared a post about this fake move. I said that It might be a bullish trap. Bitcoin may try to make lower bottom.
We will see..