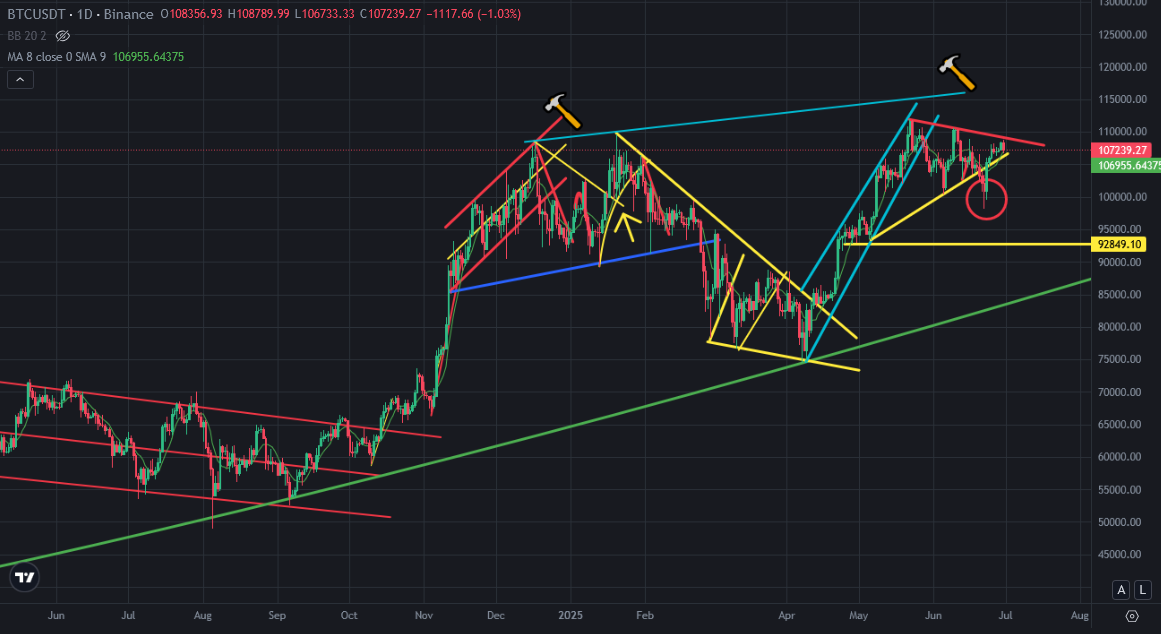
There was downtrend line on Bitcoin price chart. I shared a few analysis about this downtrend line. I was waiting for resisting on Bitcoin price chart. It happened.
Here you can see daily chart of Bitcoin. There was a bearish trap. Even there was a bearish trap on Bitcoin price chart, I was waiting for price reversing down after touching downtrend line on Bitcoin price chart and It happened.
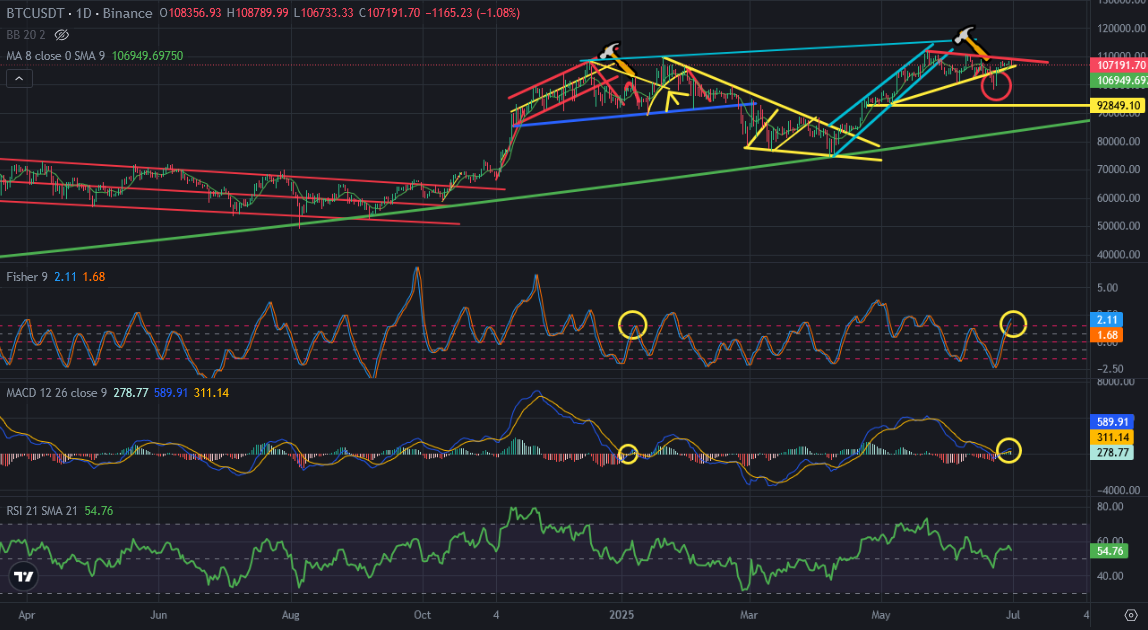
Here you can see the indicators on daily chart of Bitcoin. I circled the similarities between past and now. We have always same scenario. Even MACD Indicator reversed down from the top, It may reverse down again. Fisher Indicator is at same level as past. It should reverse down from this level. Touching downtrend line will be the reason for this reversing.
There was mini uptrend line on Bitcoin price chart. Reversing down of the indicator will be the reason for breaking down on mini uptrend line.
So, we should be ready another mini downtrend on Bitcoin price chart. I will focus the new mini downtrend on crypto market and I will share my analysis.
We will see..