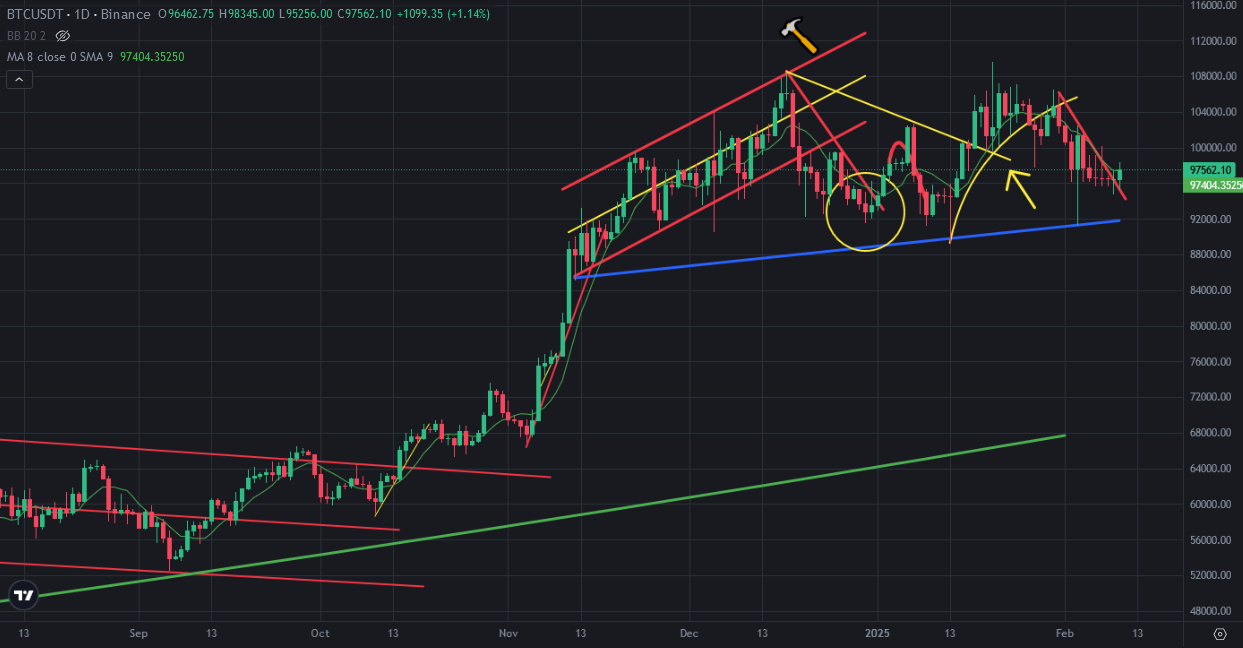
There was mini downtrend line on Bitcoin price chart. I shared a few analysis about this downtrend line. It would be broken up in this week and It happened today. Bitcoin price broke up this downtrend line today and entered short-term bullish trend. It may not be a mid-term or long-term. We may see short rally on Bitcoin price chart.
Here you can see daily chart of Bitcoin. After having small many red candles, Bitcoin price got huge green candle in daily chart. We may see green candles in following days. I said It would be very hard to break down blue support line. Bitcoin price will be supported by this great support line for long time..
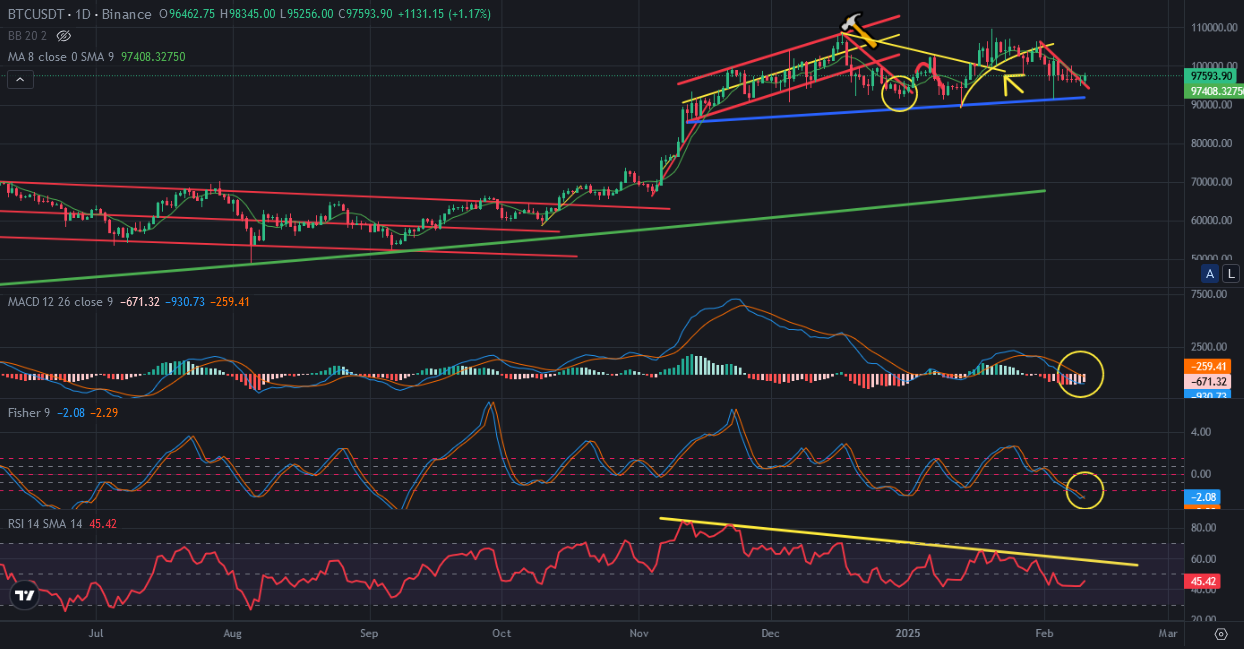
Here you can see the indicators on daily chart of Bitcoin. MACD and Fisher Indicators reversed up from the bottom. I said a few days ago this reversing. It happened in this week. This week is bullish week for crypto market. There is great downtrend line on RSI Indicator. Bitcoin price may go up to touch this downtrend line and may resist this resistance. We may see the pressure of this downtrend line on Bitcoin price chart.
As I said I may be great to pick up discounted cryptos on market. It is great chance to small trade. These level is still great for long term.
We will see..