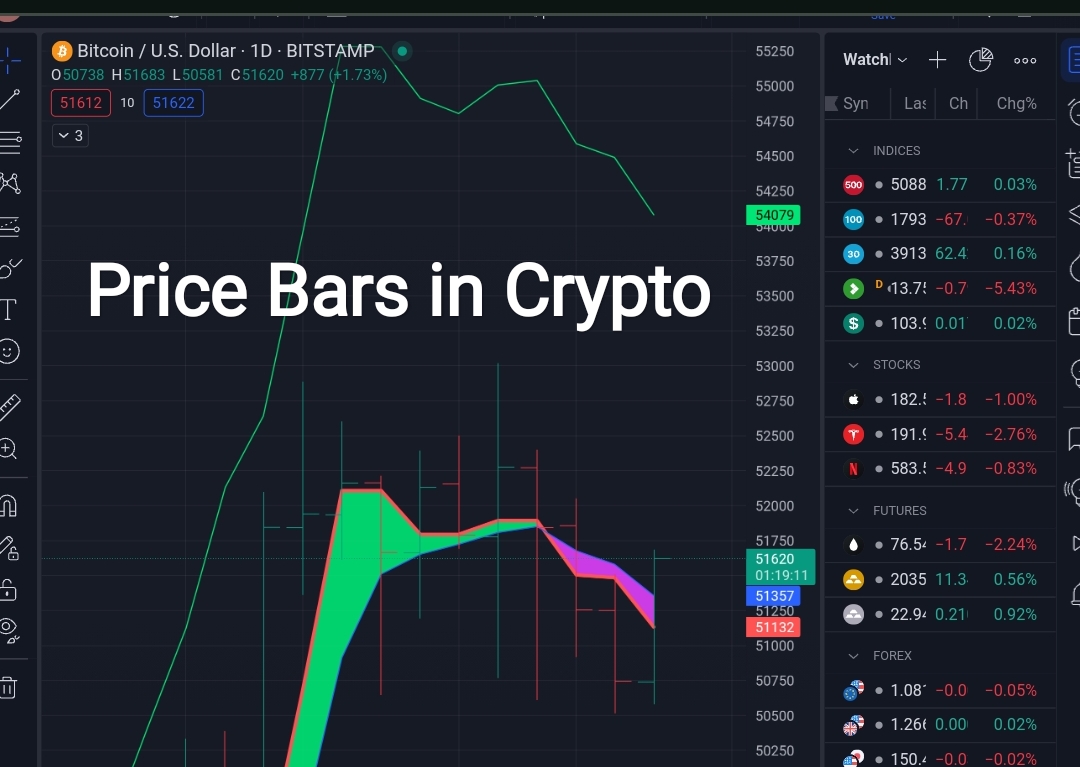
The current engagement challenge topic in steem crypto academy talks about chart patterns. This chart pattern is the analysis of price movement of a coin. Now on this charts, there are unrelated dots or bars so to speak and this can be either red or green showing how an assets price goes up or come down.
A dot in discharge is actually the price bar and represents all transactions, information concerning trading, movements of assets and the asset's demand and supply. This price bars are used in technical analysis. So if you understand this, then you are good in technical analysis as the basics. The price bar can be useful in identifying trends and changes in these trends.
**Discharge can be in numerals ways and a change in trend leads to a change in the price bar. So taking it by the definition, it defines the trading action of an asset within a specified period of time. This image below shows a price bar in which there are terms such as low, high, open and close.
The open feature is a horizontal line on the left which acts as opening price. The close feature is a horizontal line that's little and is on the right and acts as the closing price. The low feature or term is the bottom of the vertical line while the high is the top of the vertical line. How do we use these price bars in identifying trends?
After a price has been established through the execution of a trade, Traders observing have a baseline which to track the prices of an asset. They are observation using technical analysis is that the price bar in bodies all the supply demand activities for the day and series of price bars on the chart results or produces a trend. Before identifying a trend using price bars, we need to understand some related terms which will help in the identification of trends.
 |  |
|---|---|
The higher high term: this is when the high of today's trade is higher than the high of the previous day. Only when this occult it is termed as higher high. | |
Higher low: is when the low of today's trade is higher than the low of the previous day. | |
Lower low: is when today's low is lower than the low of the previous day. To use the combination of price bars to identify a trend in the market, let's see how an uptrend can be identified. | |
|
|-
If we see a series of higher highs and higher lows, then this should give us a glimpse that a trend is about to form. From this, we can understand that bulls outnumber bears. Since ago is to identify a trend and to buy near the beginning of that trend, we must first of all look at higher lows and lows of the bars and if they are two higher highs and two lower lows in two consecutive days, then it may not necessarily be an uptrend. Prices don't move in straight lines and we will often sea series of two or three higher highs interrupted by one or two lower highs.
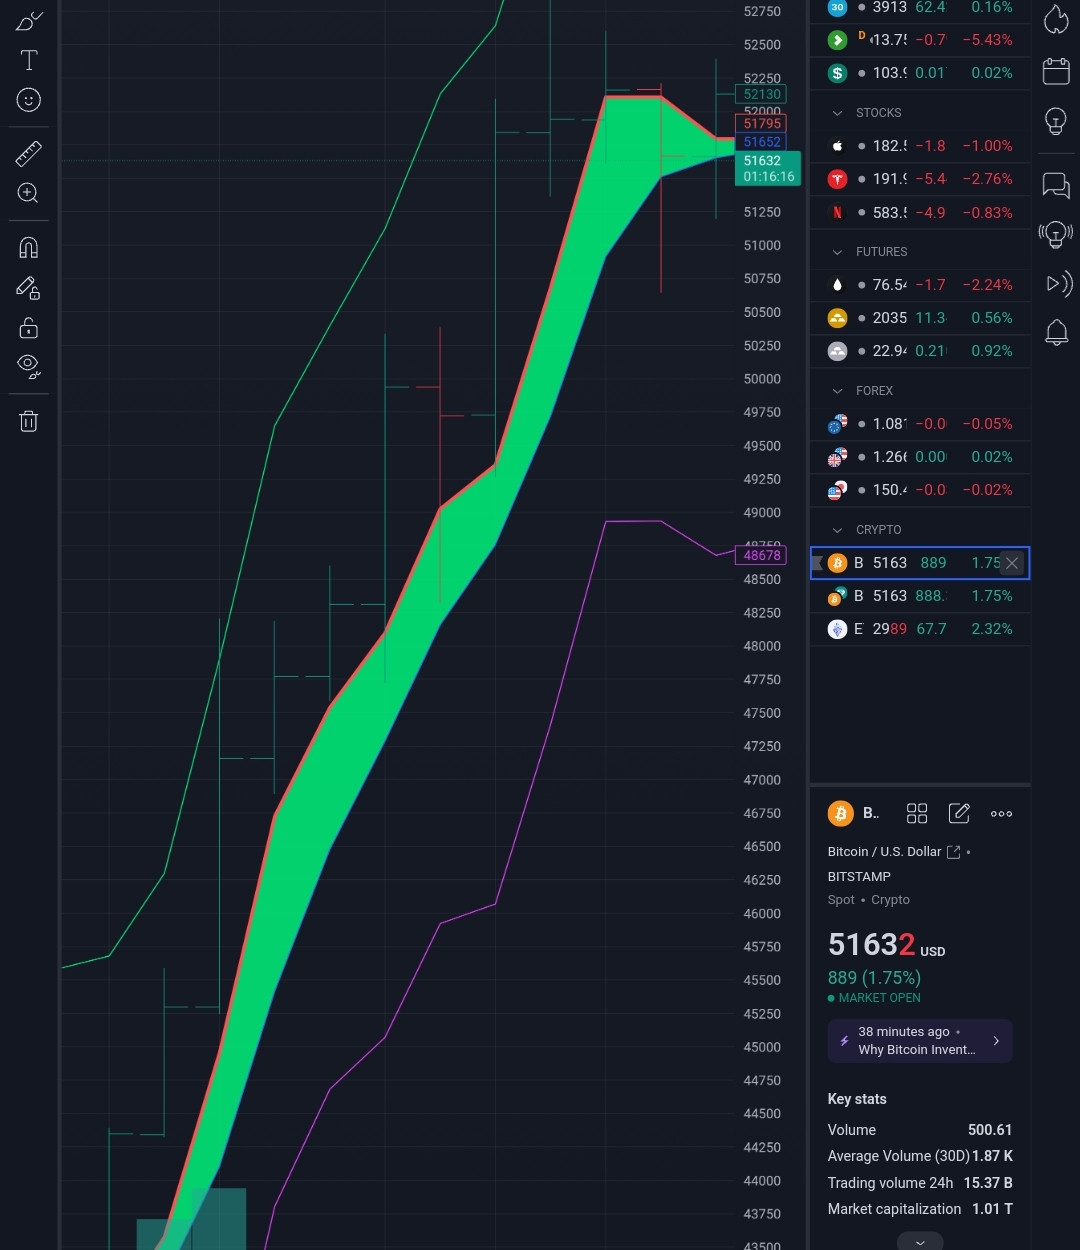
From the picture above, you can also see unbroken series of higher highs on every single day. From the screenshots you can see that every close is higher than the close of the previous day. At the same time, the price of that asset is making a fresh high but not everyday. The bar marked shows the close was higher than the open and the low was higher than the low of the previous day but the high of the previous day wasn't higher than the day before.
Even with these, this is an uptrend. We also need to understand that at this point we will not see fresh higher high everyday but we will see close higher than the open and low of the day higher than the previous day before we can identify an uptrend.
To identify a downtrend, will be looking at series of down days which means a close which is lower than previous day is characterized by lower lows and lower highs in a preponderance of price bars.
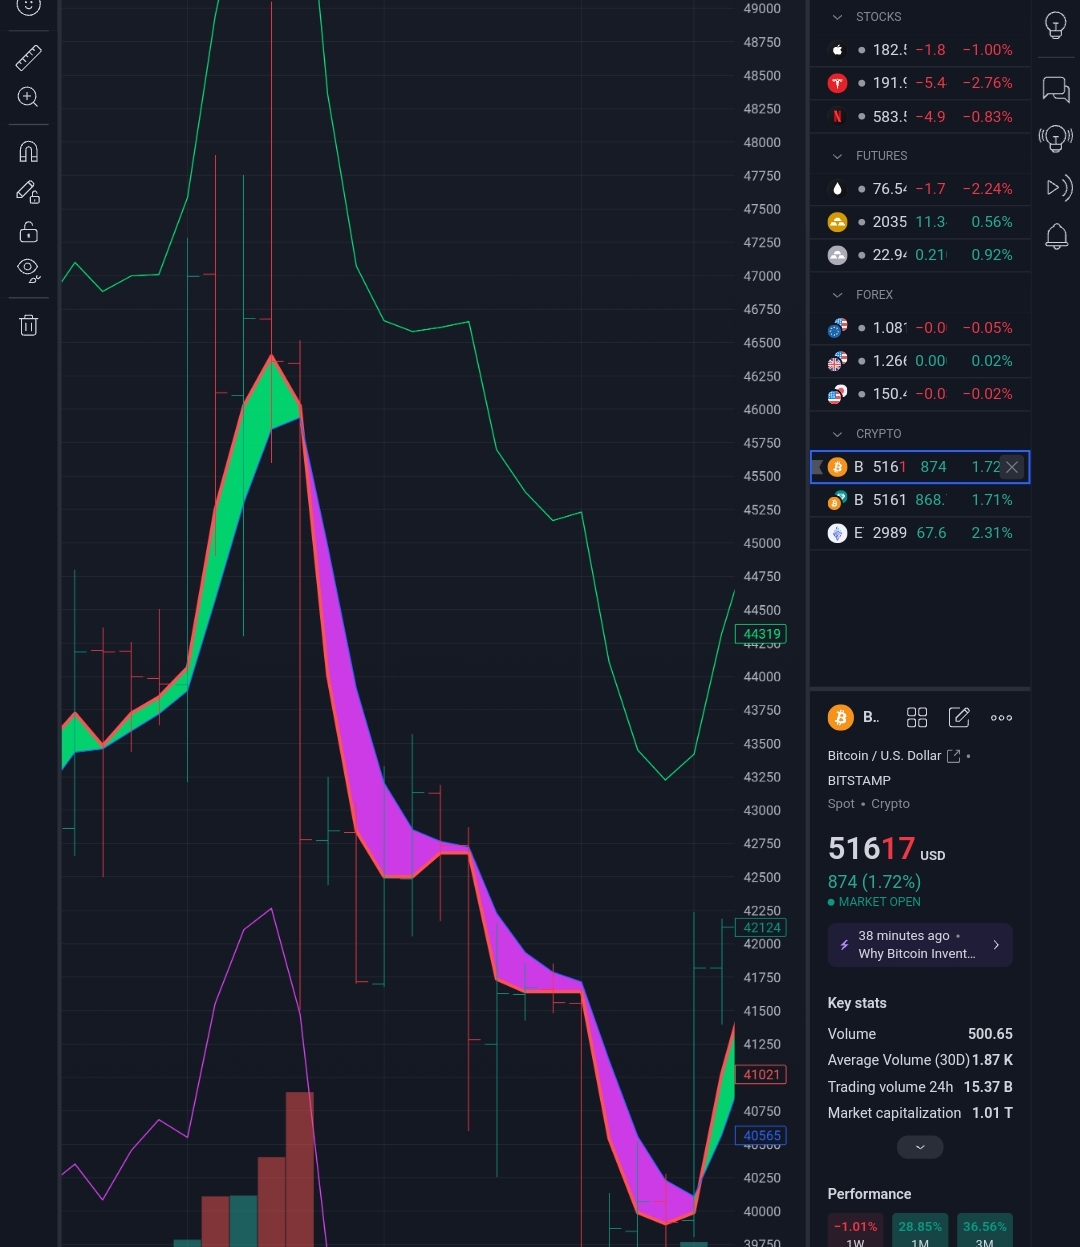
Let's look at this trade of Bitcoin downdays. After the first trade, each of these bars have a close lower than the close the previous day. It can be interrupted in the eyes but there will be a lower low every next day which shows the start of the downtrend. When identifying a downtrend, a series of lower highs is a good signal to the series of lower low. When Traders see new lower low everyday, they will prefer selling their assets as Traders are not willing to hold onto a falling asset and this result in panic selling.
In conclusion, we've seen how to identify the uptrend and downtrend using these price bars and how the higher and lower lows were involved in this this combination and analysis. We'll see how we can read the combination of these bars
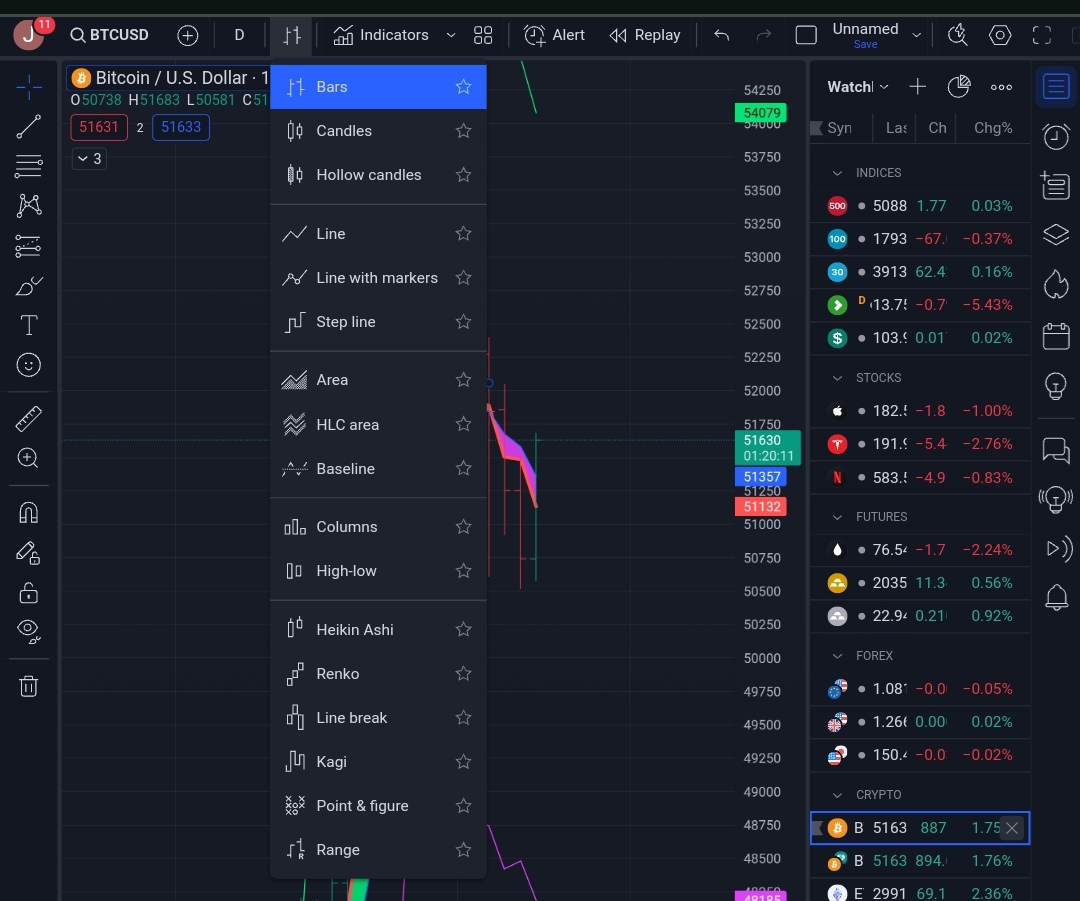
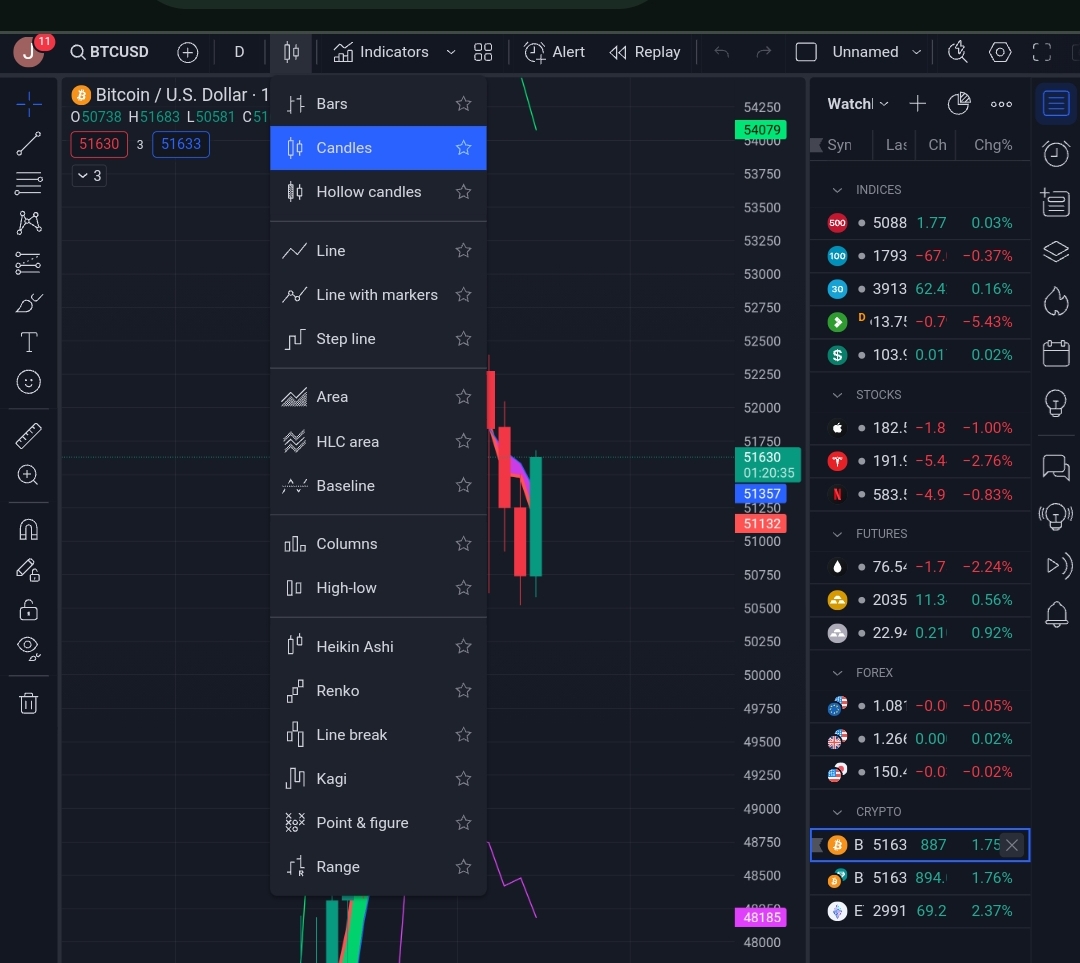
All screenshots are from my trading view
Disclaimer :Any financial and crypto market information provided in this post was written for informational purposes only and does not constitute 100% investment advice. It's just basic knowledge every crypto trader or investor should have