XRP, the cryptocurrency known for its volatility, has encountered significant hurdles in recent trading sessions. Here's a breakdown of its current market status:
Decline Below Critical Support Zones
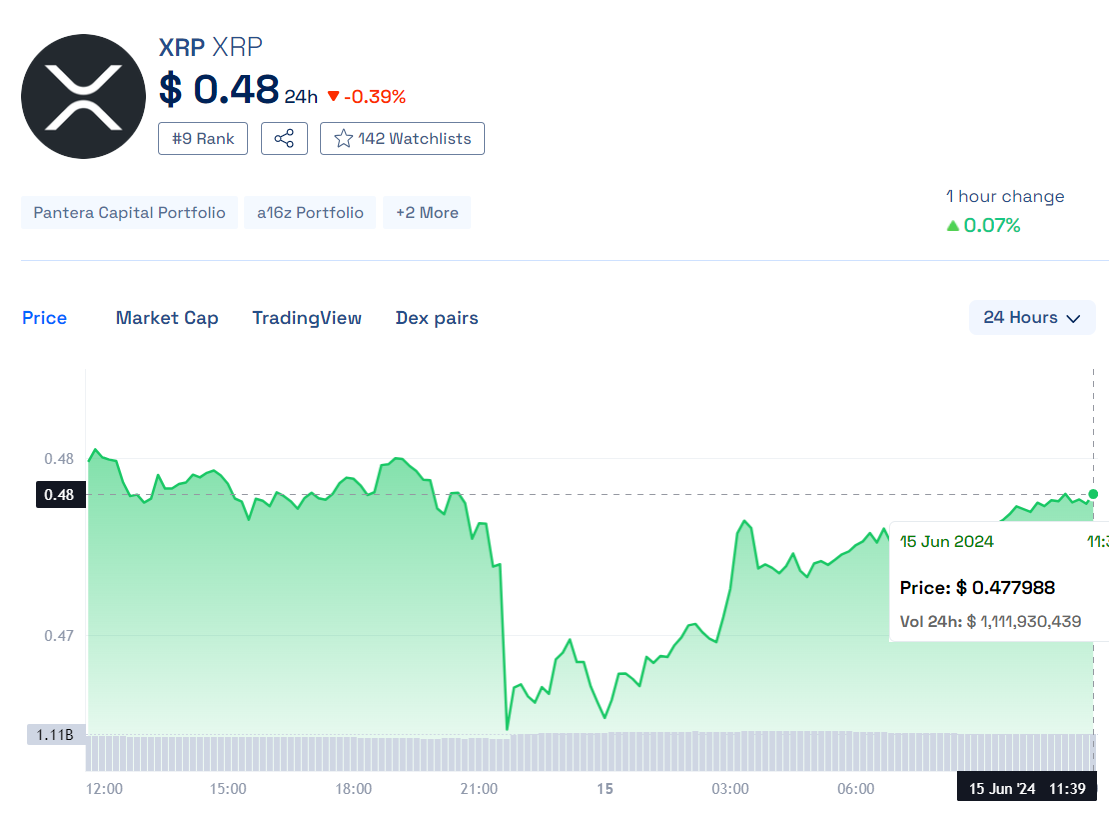
XRP initially struggled to maintain its position above the crucial $0.4840 support level. Unfortunately, the price saw a decline and tested the lower $0.4750 support area. This downward movement has put XRP at risk of further losses.
Current Trading Position
As of the latest market update, XRP has slipped below both the $0.4840 support zone and the 100-hourly Simple Moving Average (SMA), currently trading under $0.4880. On the hourly chart sourced from Kraken, a bearish trend line has formed with resistance noted at $0.4880. Analysts suggest that any recovery attempts might face limitations near the $0.4920 resistance mark.
Recent Price Action
The downward trend intensified after XRP failed to reclaim levels above $0.4950, akin to setbacks observed in other major cryptocurrencies like Ethereum and Bitcoin. Following a decline from the $0.4981 high, XRP saw prices dip below successive support levels at $0.4880 and $0.4850, eventually settling near $0.4746. Currently, XRP is consolidating losses and testing the 23.6% Fibonacci retracement level from its recent high to low swing.
Outlook and Key Levels to Watch
Moving forward, the immediate focus lies on whether bulls can defend the $0.4740 support level. If successful, a potential upside correction could be anticipated. However, resistance awaits near $0.4820, with crucial barriers at $0.4850 and the 50% Fibonacci retracement level. Further challenges are anticipated at the $0.4950 resistance, which could pave the way for an upward trajectory towards $0.5050 and potentially higher to $0.5250 or even $0.5320.
Downside Risks and Technical Indicators
Should XRP fail to surpass the $0.4850 resistance barrier, market sentiment could turn bearish, potentially driving the price towards lower support levels near $0.4740 and $0.4700. A breach below the $0.4700 mark might trigger increased selling pressure, potentially retesting the $0.450 support area in the near term.
Technical Indicators: The hourly MACD for XRP/USD indicates momentum in the bearish zone, while the hourly Relative Strength Index (RSI) is currently below the 50 level, highlighting prevailing selling pressure.
XRP faces a critical juncture as it navigates through these support and resistance levels, with market participants closely monitoring developments for potential trading opportunities and strategic adjustments.