Arweave's (AR) price is caught in a tug-of-war between bullish and bearish signals on the daily and weekly timeframes. Here's a breakdown of the key factors at play:
'
https://coinpedia.org/price-analysis/contrasting-ar-price-patterns-warns-sharper-moves-ahead/
Daily Chart: Bullish Bias
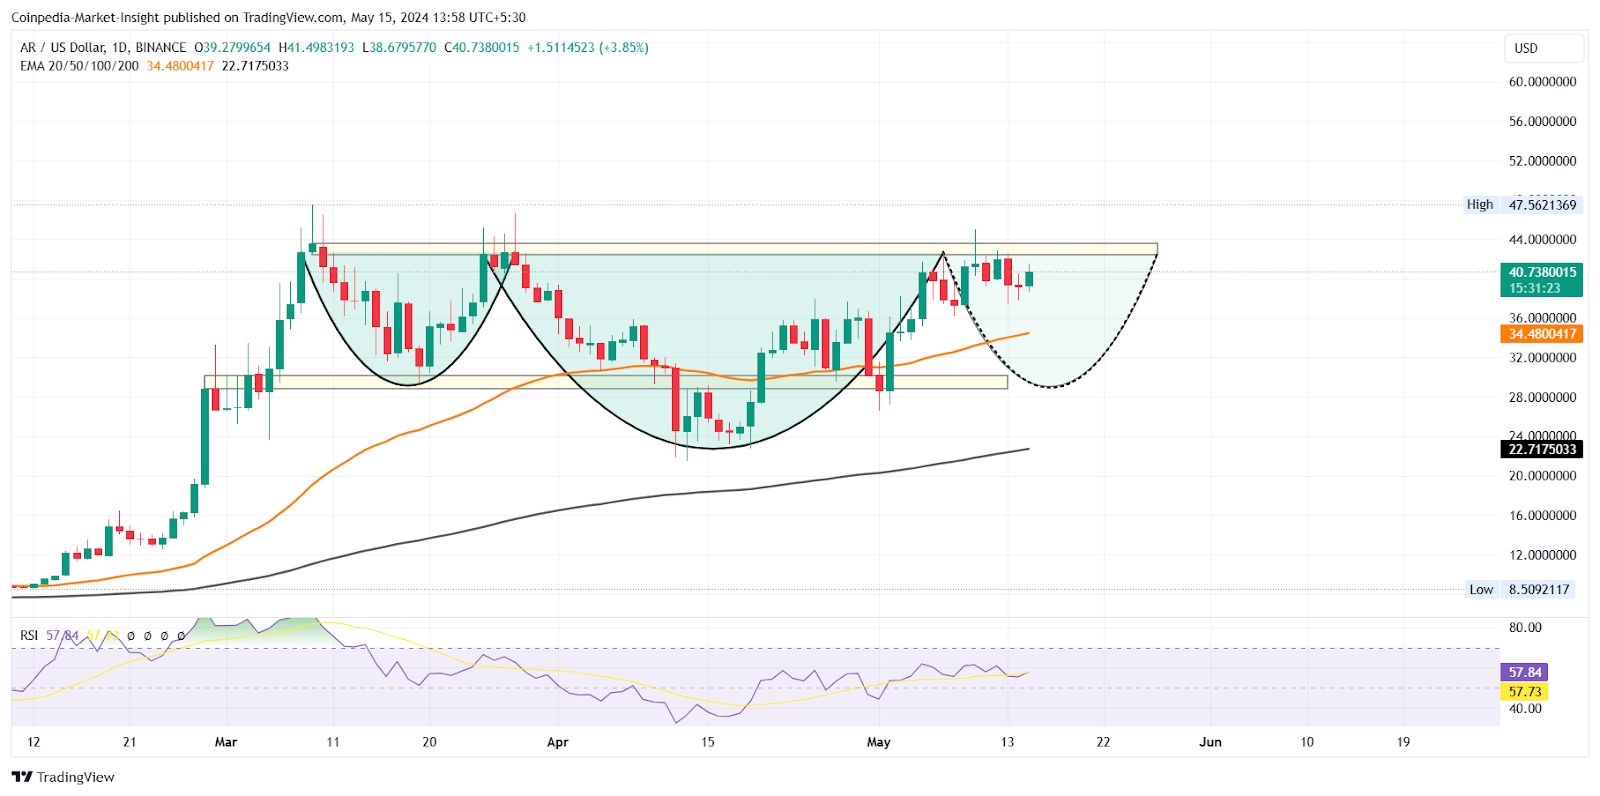
Inverted Head and Shoulders: This bullish reversal pattern suggests a potential breakout rally if AR surpasses the neckline at $44. This could propel the price towards $100 by year's end, aligning with the analyst's prediction of a prolonged uptrend.
Morning Star Pattern: This intraday pattern indicates a potential reversal from the recent drop, further strengthening the bullish outlook.
Technical Indicators: The daily RSI approaching the overbought zone reflects growing demand, and the 50D and 200D EMAs provide dynamic support.
Bullish Engulfing Candle: This emerging pattern suggests bullish momentum building, potentially leading to a surge above $44.
Weekly Chart: Bearish Undercurrents
Double Top: This bearish reversal pattern warns of a potential price drop if AR fails to break above $50. A reversal could drag the price down to $30 or lower.
The Verdict: A Critical Week for AR
This week is crucial for determining AR's future trajectory. If the bulls can push the price above $44 and sustain it above $50, a breakout rally towards $65 and potentially $100 becomes a possibility. However, a failure to break above $44 and a subsequent drop below $30 would signal a bearish trend.