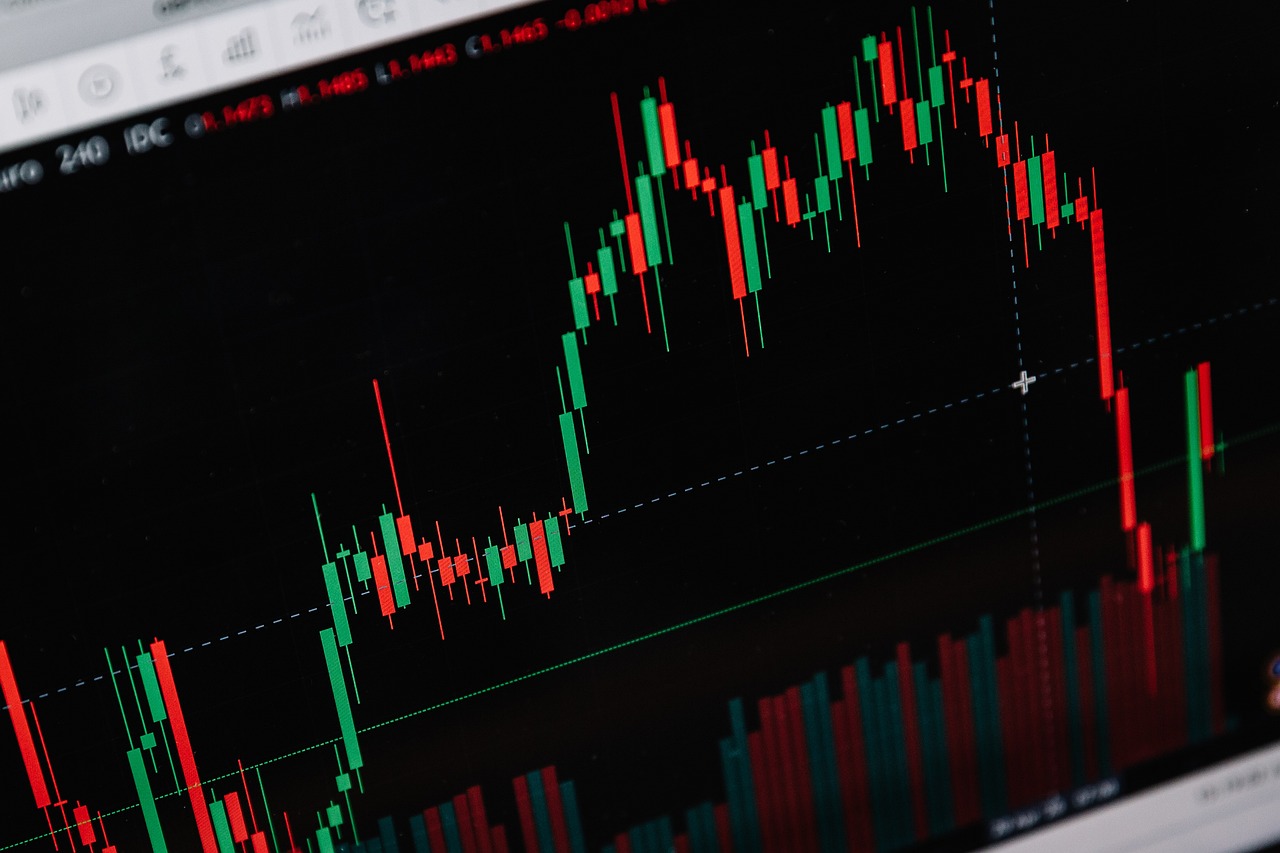
Many of us who are involved in trading activities have an idea about Candlestick Patterns. Traders know these things very well because they have to make trading decisions through candlestick patterns and chart analysis. A trader has to do trading tasks keeping in mind not only support and resistance but also many other factors, so I will try to explain to you some of the samples of Candlestick Patterns that are available in the field of trading.
I will try to share 4 patterns with you in each post and explain things with examples so that you can get a basic idea about these patterns through discussion without pictures. Below are 2 common candlestick patterns along with explanations and examples for each (more will be shared in the next post). These comprehensive examples of candlestick patterns are used in technical analysis for trading various financial instruments like cryptos for example Bitcoin, Ethereum, etc.
1. Doji
The Doji candlestick pattern is a small body with wicks on both ends. It indicates that the open and close prices are virtually equal. It suggests market indecision and uncertainty about the future direction of the asset's price.
Example:
Suppose Bitcoin (BTC) is trading at $50,000, and a Doji candlestick forms on the daily chart. The open and close prices are both around $50,000, with wicks extending above and below the body of the candlestick. This pattern suggests that neither bulls nor bears are in control, signaling a potential reversal or continuation depending on the market context.
2. Hammer
The Hammer candlestick pattern has a small body near the top of the price range and a long lower shadow. It indicates that despite a significant sell-off during the period, buyers were able to push the price back up. It suggests a potential reversal from a downtrend to an uptrend.
Example:
Suppose Ethereum (ETH) experiences a sharp decline from $2,500 to $2,000 during a trading session but closes near the high of the day at $2,100, forming a Hammer candlestick. This pattern suggests that buyers stepped in to support the price after the sell-off, potentially signaling a reversal in the downtrend.
To be continued.
~ Regards,
VEIGO (Community Mod)
We're die-hard fan of Tron Blockchain