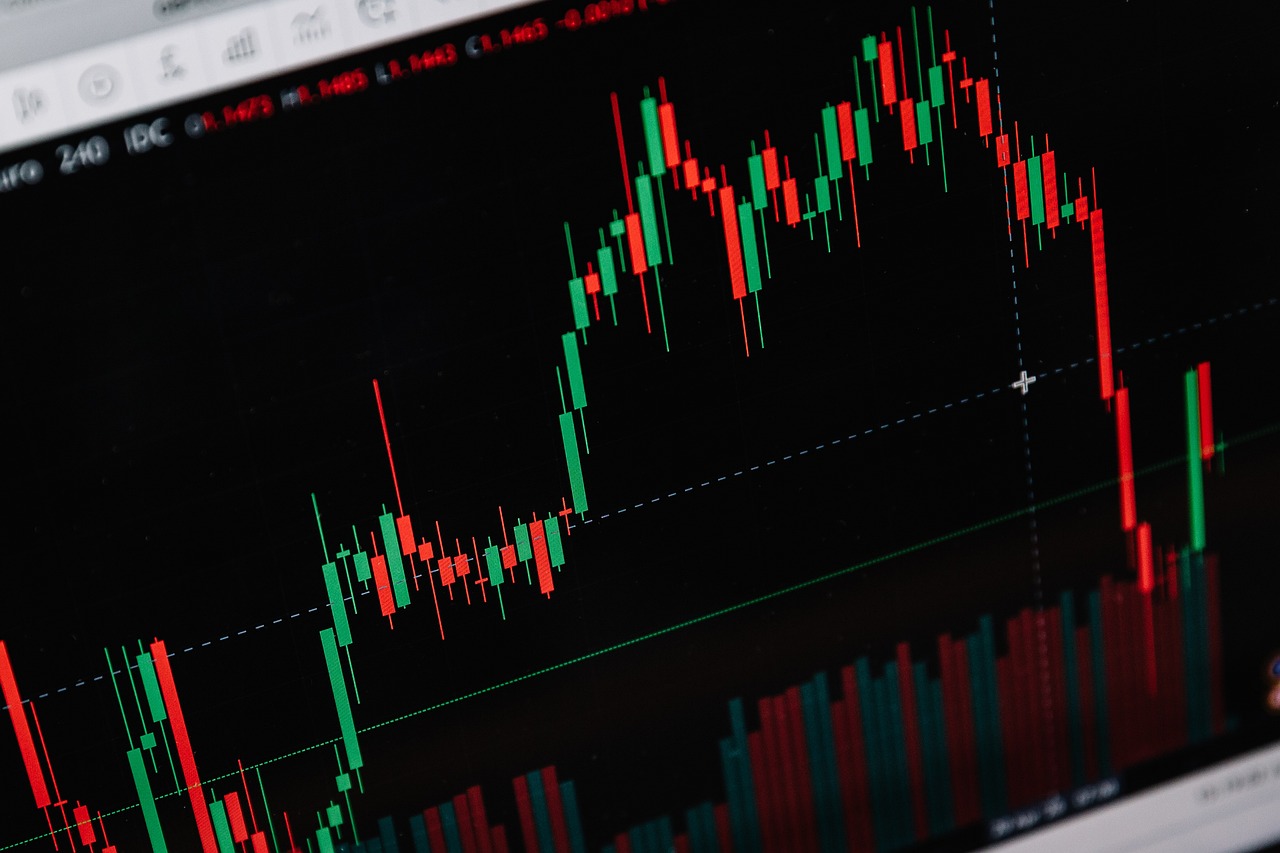
I have been discussing crypto trading consistently in the past several posts. Some of these previous posts have discussed candlestick patterns and currently I am discussing some medium and advanced level trading patterns. I am basically trying to introduce you to six tools and in the last post I introduced two tools to you. In continuation of that, today I will introduce two more tools to you and hope that these tools will help you to make decisions in your trading and make profit through decisions.

3. Elliott Wave Theory
Elliott Wave Theory is a complex technical analysis method that identifies recurring wave patterns in financial markets. It is based on the principle that market prices move in repetitive waves of varying lengths and sizes. According to Elliott Wave Theory, markets move in cycles of five waves in the direction of the main trend (impulse waves) followed by three corrective waves (corrective waves). Traders use wave analysis to predict future price movements and identify potential reversal points.
Example:
By identifying Elliott Wave patterns on a price chart, traders can anticipate future price movements and adjust their trading strategies accordingly.
4. Volume Profile
Volume Profile is a technical analysis tool that plots the volume traded at various price levels over a specified period. It helps traders identify areas of high and low trading activity, which can serve as support and resistance levels.Volume Profile displays a histogram of trading volume at each price level, showing where the majority of trading activity has occurred. Traders use this information to identify price levels where there is significant buying or selling interest.
Example:
If a cryptocurrency has a high volume node (a peak in trading volume) at a certain price level, it may act as strong support or resistance in the future, as traders tend to react to price movements at these levels.
~ Regards,
VEIGO (Community Mod)

