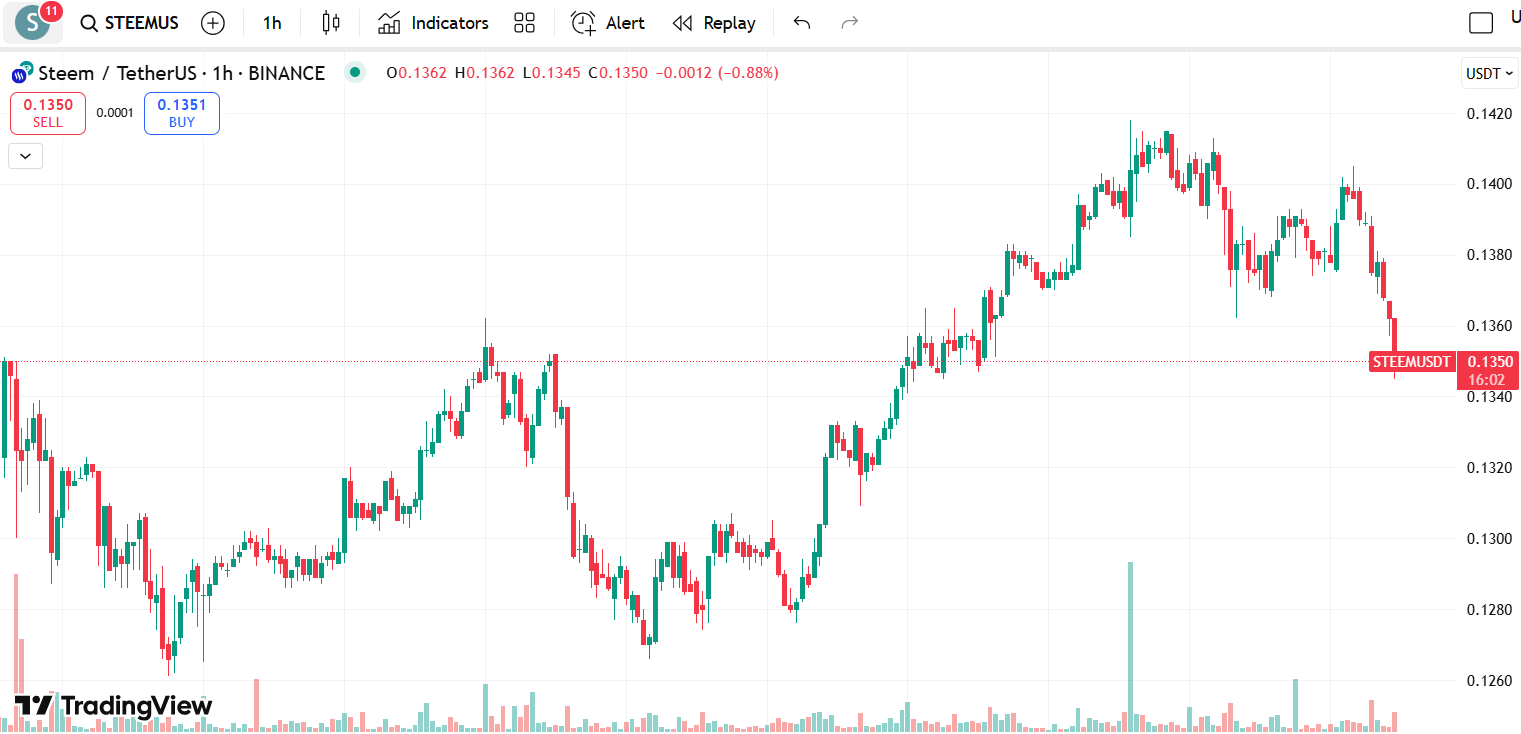
The Steem token has shown a mixed performance in the last trading sessions, as reflected in the 1-hour chart. After a strong upward move that peaked near $0.1420, the price has since corrected and is currently trading around $0.1350, marking a 0.88% decline in the latest hourly candle.
Trend Overview
- Short-term trend: Bearish momentum in the past few hours, with lower highs and lower lows forming since the last peak.
- Medium-term trend: Still moderately bullish compared to the lows earlier in the week, as price remains above the $0.1300 support level.
- Volatility: Increasing in the latest sessions, as seen from larger candle bodies and rising volume during the sell-off.
Key Support and Resistance Levels
- Immediate support: $0.1340 – Recent low and potential bounce zone.
- Secondary support: $0.1300 – Strong psychological and technical level from previous consolidations.
- Immediate resistance: $0.1380 – Minor level where recent rebounds were rejected.
- Major resistance: $0.1420 – Weekly high.
Volume & Market Sentiment
The volume profile shows notable spikes during both the initial rally and the recent sell-off, indicating active participation from both buyers and sellers. The recent red candles with increasing volume point toward stronger selling pressure.
Possible Scenarios
- Bullish case: A hold above $0.1340 could invite buyers back into the market, pushing price toward $0.1380 and possibly retesting $0.1420 if momentum builds.
- Bearish case: A breakdown below $0.1340 could accelerate the decline toward $0.1300, which will be critical for maintaining medium-term bullish structure.
Conclusion
The current pullback in STEEM is a short-term bearish move within a larger consolidation zone. Traders should watch the $0.1340 level closely for signs of reversal or continuation. Momentum indicators (RSI, MACD) on lower timeframes could help confirm the next direction.