Update since August 10 TA
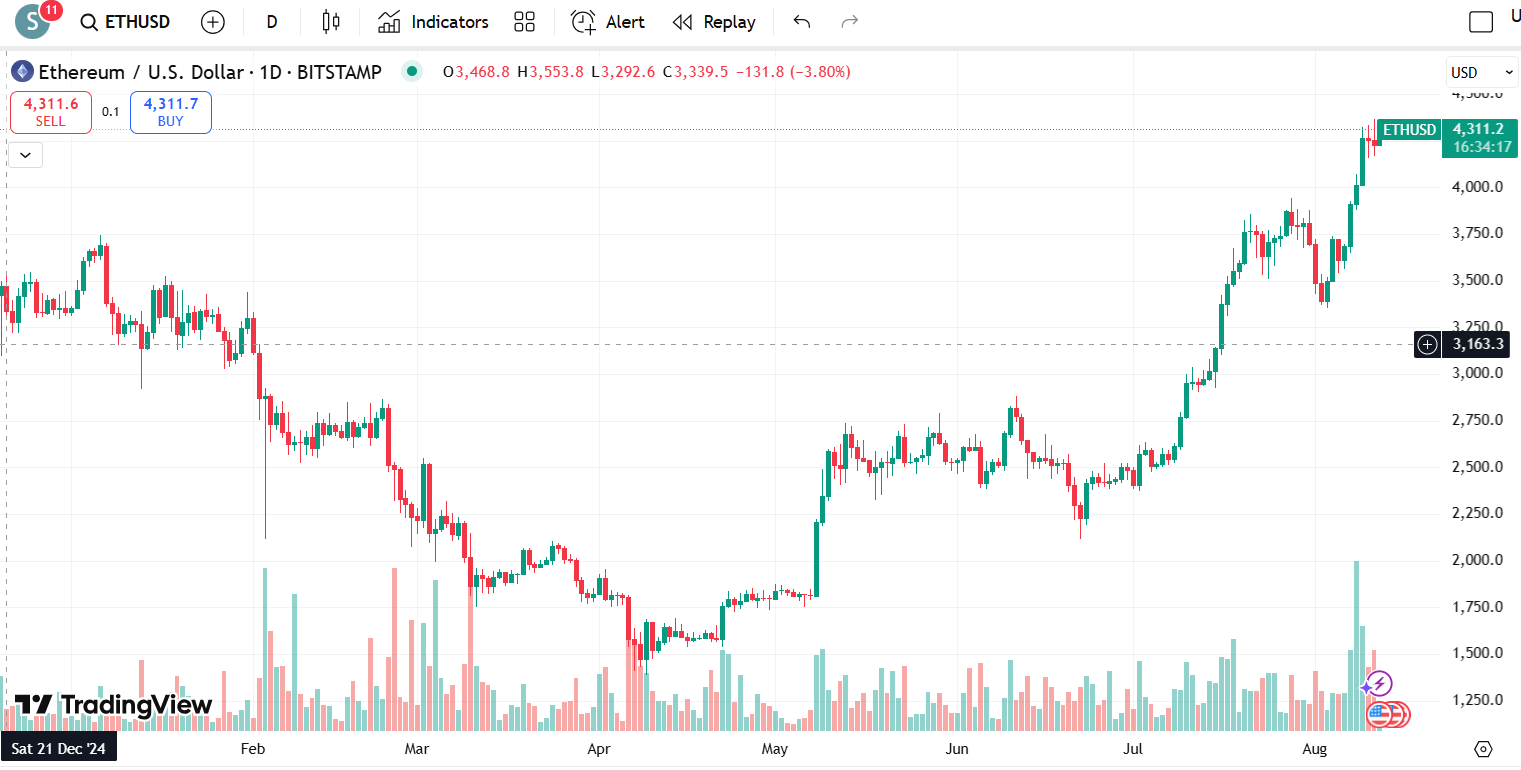
Two days ago, Ethereum (ETH/USD) was trading around $4,196, having just pulled back from its recent high near $4,332. At that time, the outlook was cautiously bullish, with $4,000 as key support and $4,350 as the resistance to break for further upside.
What Has Happened Since?
- ETH pushed higher shortly after the last analysis, briefly reclaiming momentum and reaching the $4,311 zone.
- The move confirms that buyers stepped back in after the pullback, defending the $4,000 support level.
- Volume during the recovery was healthy, but not as explosive as during the breakout above $4,000 — suggesting some hesitation among traders at current highs.
Current Chart Overview
- Trend: The broader uptrend from mid-July remains intact, with a series of higher highs and higher lows.
- Resistance: $4,330–$4,350 remains the major ceiling — still unbroken.
- Support:
- $4,150–$4,000: Immediate support zone from recent price action.
- $3,800: Stronger support from the last consolidation phase.
Key Observations
- The price is consolidating just below major resistance — a bullish sign if it holds here without sharp rejection.
- Sustained buying pressure could finally trigger a breakout above $4,350.
- On the downside, a failure to hold $4,150 could lead to a retest of $4,000 and potentially $3,800.
Expectations Going Forward
- Bullish Scenario: A confirmed breakout and close above $4,350 would likely trigger a quick push toward $4,500–$4,800. Momentum traders will be watching this level closely.
- Bearish Scenario: If ETH fails to break $4,350 and selling pressure increases, a pullback toward $4,000 could occur before the next rally attempt.
Outlook: Still bullish, but the market is at a decision point. The next few days should confirm whether Ethereum is ready for another leg up or if it needs deeper consolidation before moving higher.