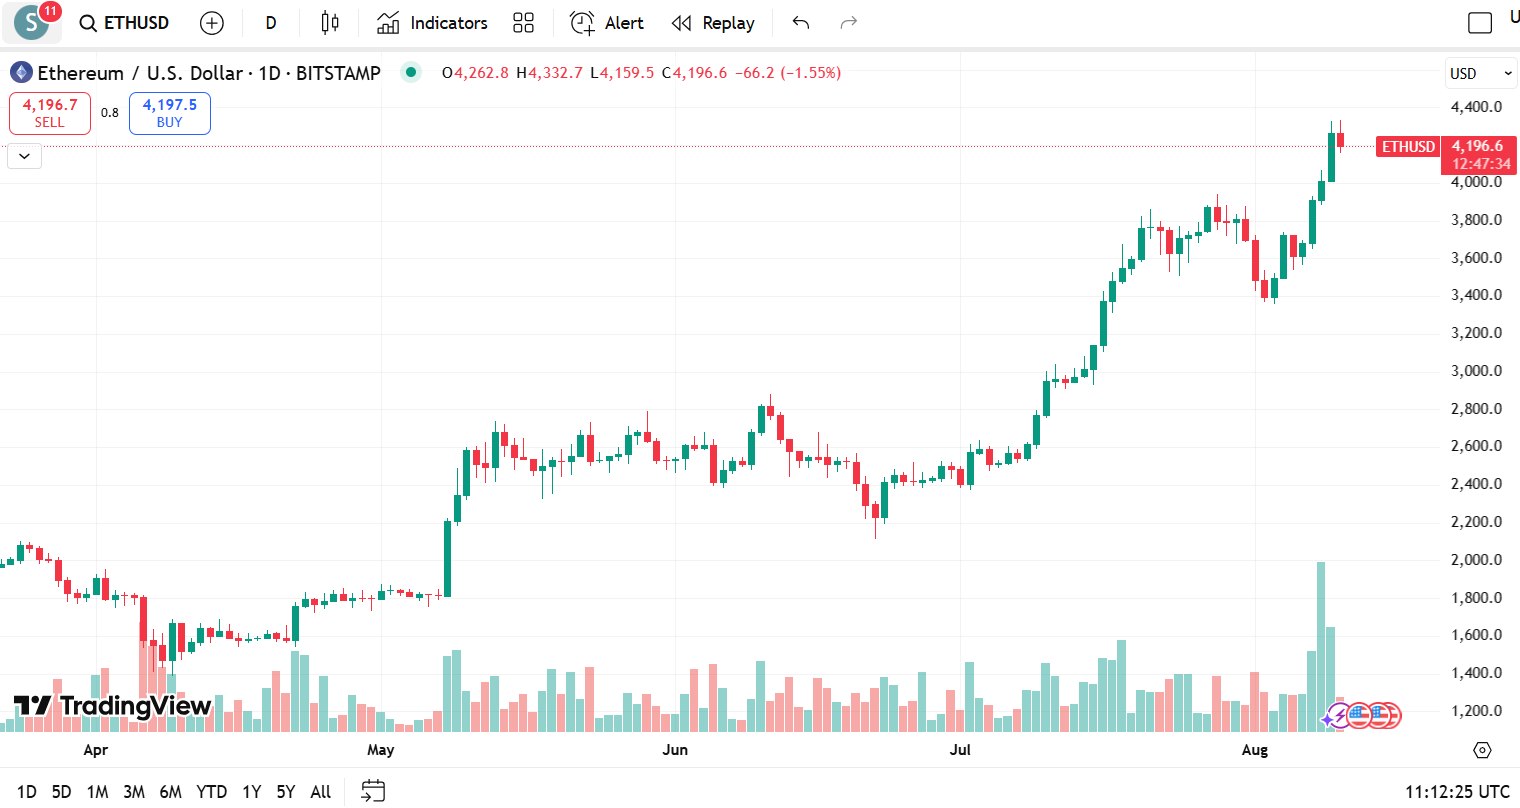
Ethereum (ETH/USD) is currently trading at $4,196, down 1.55% for the day after hitting a recent high of $4,332. Despite today’s red candle, the broader trend remains firmly bullish.
Chart Overview
- Trend: Ethereum has been in a strong uptrend since mid-July, breaking through several resistance levels in rapid succession.
- Current Price Action: The recent surge pushed ETH above the $4,000 psychological level, but today’s candle shows a pullback from the highs.
- Volume: A notable spike in trading volume accompanied the breakout above $4,000, suggesting strong participation from buyers, though today’s lower close hints at some profit-taking.
Key Levels
- Resistance:
- $4,330–$4,350: The recent high and current resistance zone. A breakout here could open the path to $4,500 and $4,800.
- Support:
- $4,000: Key psychological and technical support level.
- $3,800: Stronger support zone from the previous consolidation range.
Indicators & Momentum
- Trend Strength: Price action is still above recent consolidation highs, indicating that the uptrend is intact.
- Short-Term Weakness: The current red candle after a strong rally signals a possible short-term correction or consolidation before the next move higher.
- Potential Pullback Zone: If the $4,000 level fails to hold, ETH may retest $3,800 before resuming upward momentum.
Expectations
- Bullish Scenario: If ETH holds above $4,000 and regains upward momentum, a breakout above $4,350 could send the price toward $4,500–$4,800 in the short term.
- Bearish Scenario: Failure to maintain $4,000 support could lead to a deeper retracement toward $3,800, possibly slowing the rally.
Outlook: Cautiously bullish – the trend is still up, but the current pullback suggests the market may need a brief consolidation before attempting another breakout.