The Setup: Why Everyone Is Nervous Right Now
Ethereum has been quietly bleeding. As of June 13, 2026, ETH trades at $1,663 — down significantly from its 2025 highs above $3,000. The broader crypto market is soaked in fear. Social media chatter is bearish. Headlines are grim. And yet, if you look beneath the surface — past the candlesticks and Twitter noise — a more nuanced and potentially opportunity-rich picture begins to emerge.
This article dissects Ethereum from two angles: the technical (price action, chart structure, momentum indicators) and the fundamental (on-chain data, developer activity, market sentiment metrics). Our goal? To give you — whether you are a casual observer or a serious investor — a complete, honest, and data-driven perspective on where ETH stands today.
Part 1: Technical Analysis — The Chart Does Not Lie
Price Structure: A Triangle That Broke Down
The ETH/USD daily chart tells a story of exhausted bulls and emboldened bears. After forming what appeared to be an ascending triangle pattern between February and May 2026 (a classically bullish continuation setup), price decisively broke downward in early June — invalidating the pattern and triggering a sharp sell-off from the $2,000 zone to the current $1,663 level.
Two key support levels now define the near-term fate of Ethereum:
• Immediate Support at $1,383 — This is the next logical demand zone where buyers historically stepped in.
• Major Support at $875 — A deep structural level from the 2022-2023 bear market floor. A test of this level would represent a catastrophic breakdown.
The resistance to watch on any recovery: $1,814 — the former support level that has now flipped to resistance.
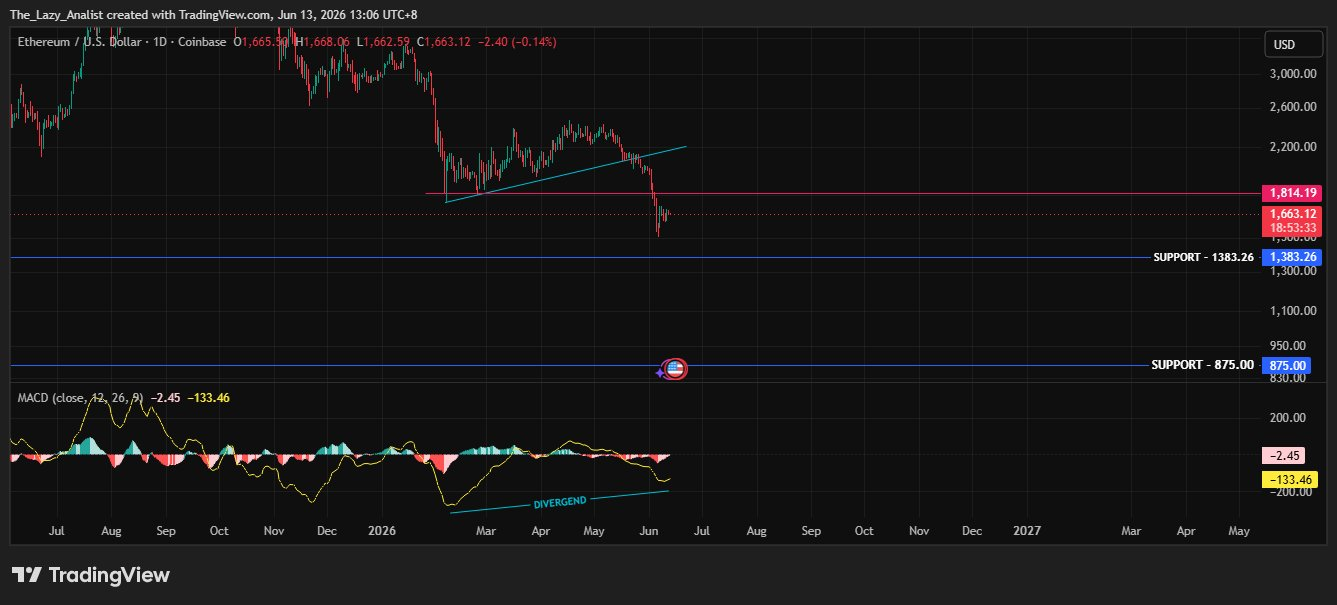
Analyst Note: Bullish divergence on MACD does NOT guarantee a reversal — it is a warning shot, not a green light. Price must confirm with a higher low and break above $1,814 before any bullish thesis becomes credible. Until then, the path of least resistance remains downward.
Part 2: Sentiment Data — The Crowd Is Terrified
Part 3: On-Chain & Cycle Indicators — The Smart Money Signal
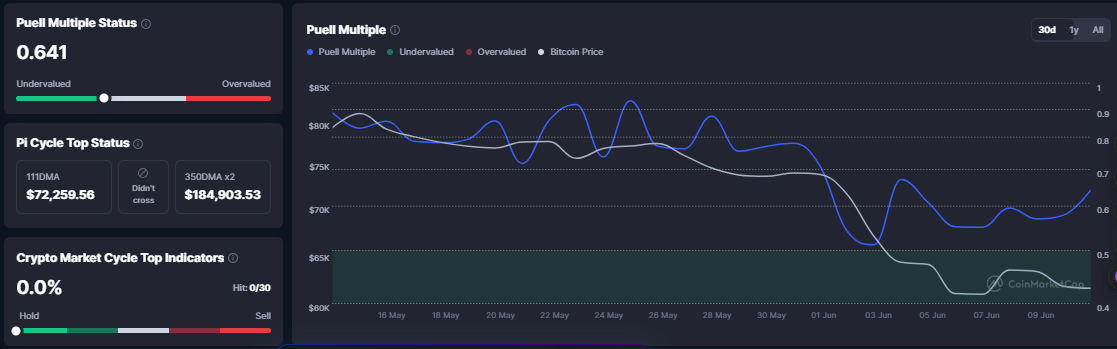
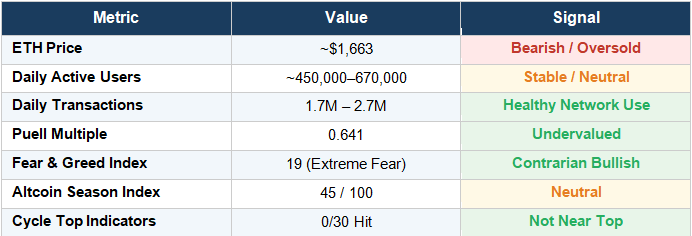
The raw on-chain numbers from the uploaded dataset paint a nuanced picture. Below is a summary of key metrics tracked over the past 30 days. Daily Active Users have declined from a peak of 669,505 (May 13) to a trough near 392,000 before stabilizing in the 450,000–550,000 range. This is not collapse-level activity — it reflects a market in consolidation rather than abandonment. Transaction volumes remain healthy in the 1.7M–2.7M daily range, suggesting the Ethereum network continues to be actively used even during the price drawdown. This is a critical distinction: network utilization has not cratered alongside price — a historically bullish divergence.
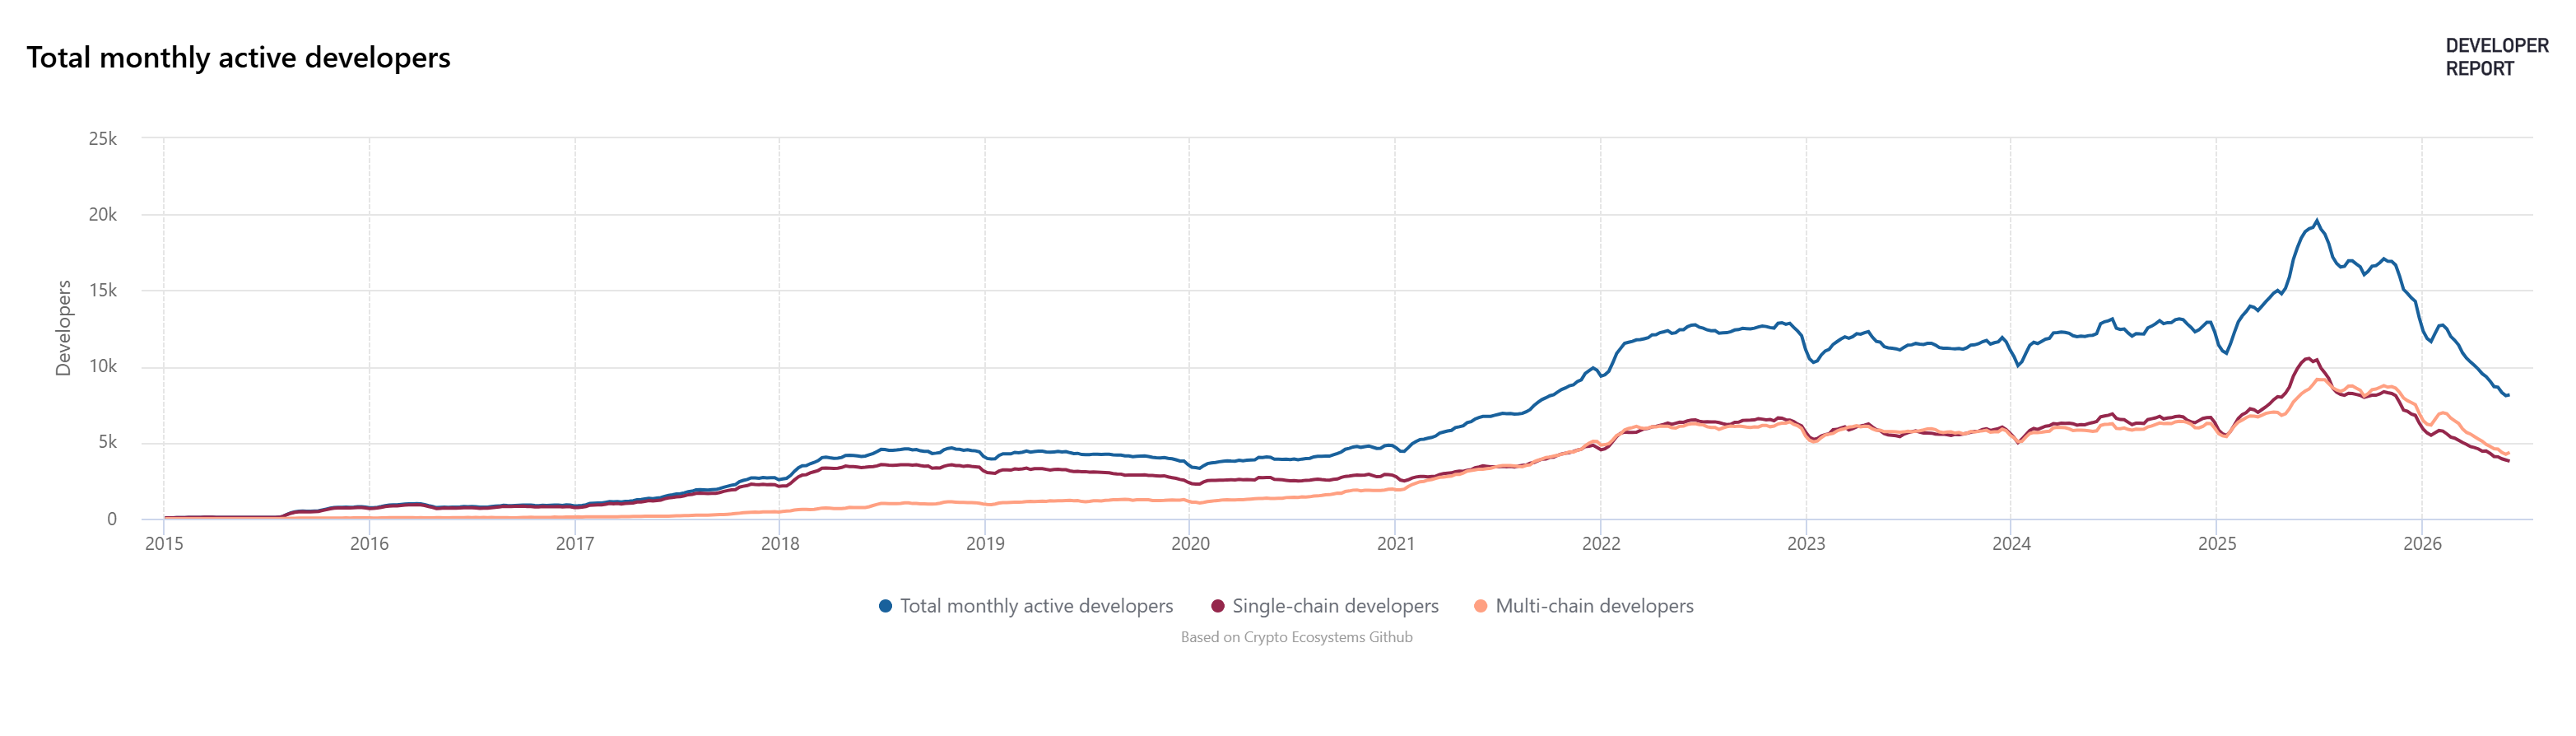
Part 4: Developer Activity — The Foundation That Price Cannot Buy
Perhaps the most underappreciated signal in crypto is developer activity. Unlike price, which can be influenced by sentiment, leverage, and manipulation, developer activity reflects genuine long-term conviction in a protocol.
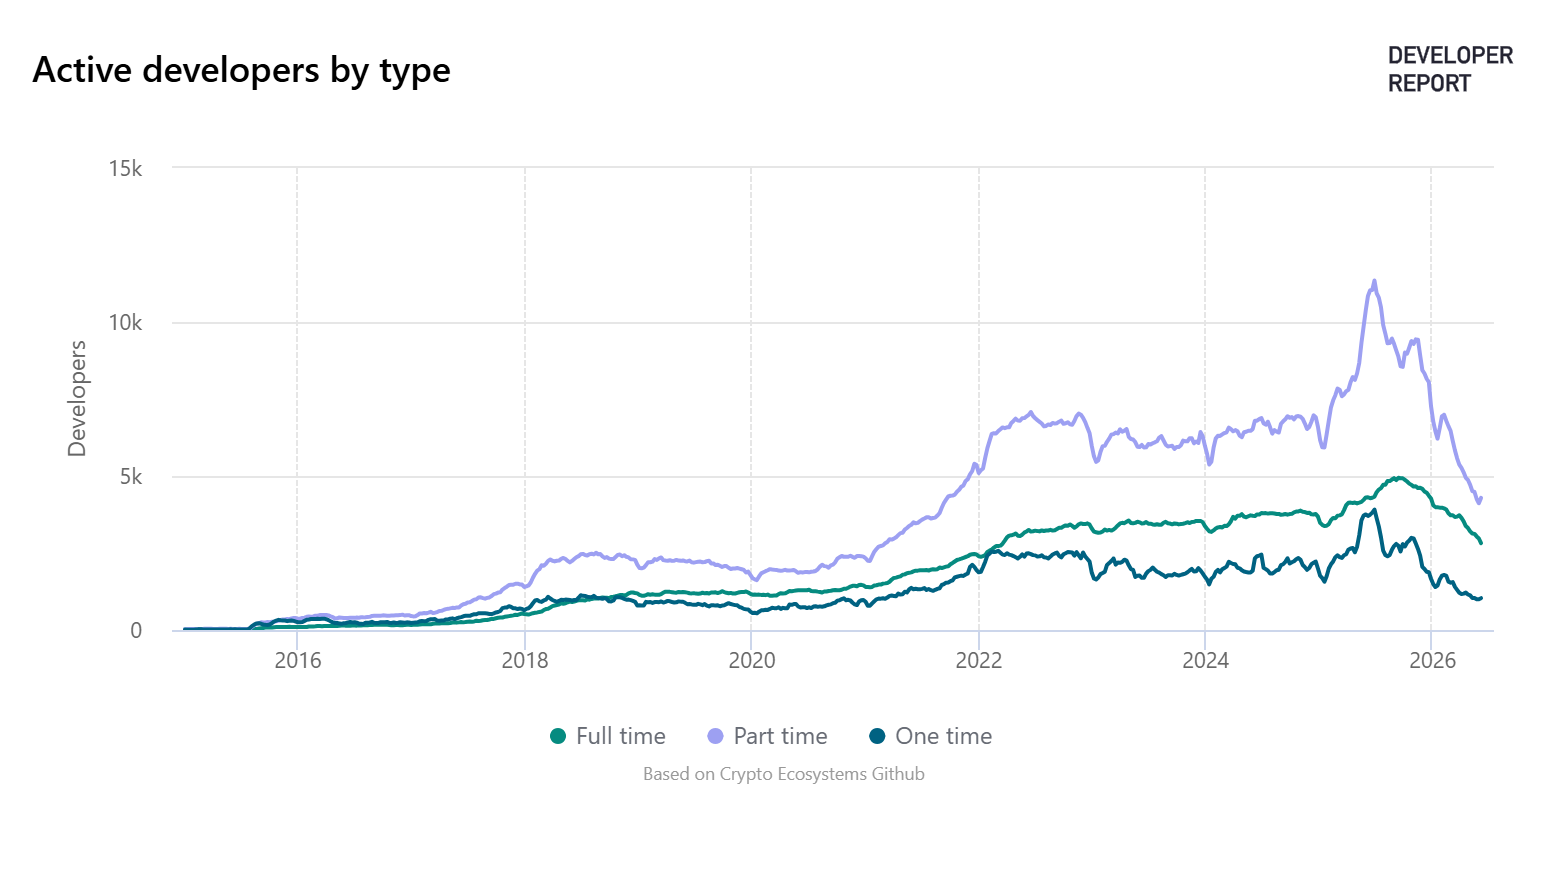
By type, full-time developers have maintained a relatively stable count (~3,000–5,000), which is the most important metric for protocol sustainability. Part-time contributors (which inflated massively during the 2025 bull run to ~11,000) have now corrected to a more sustainable ~4,000.
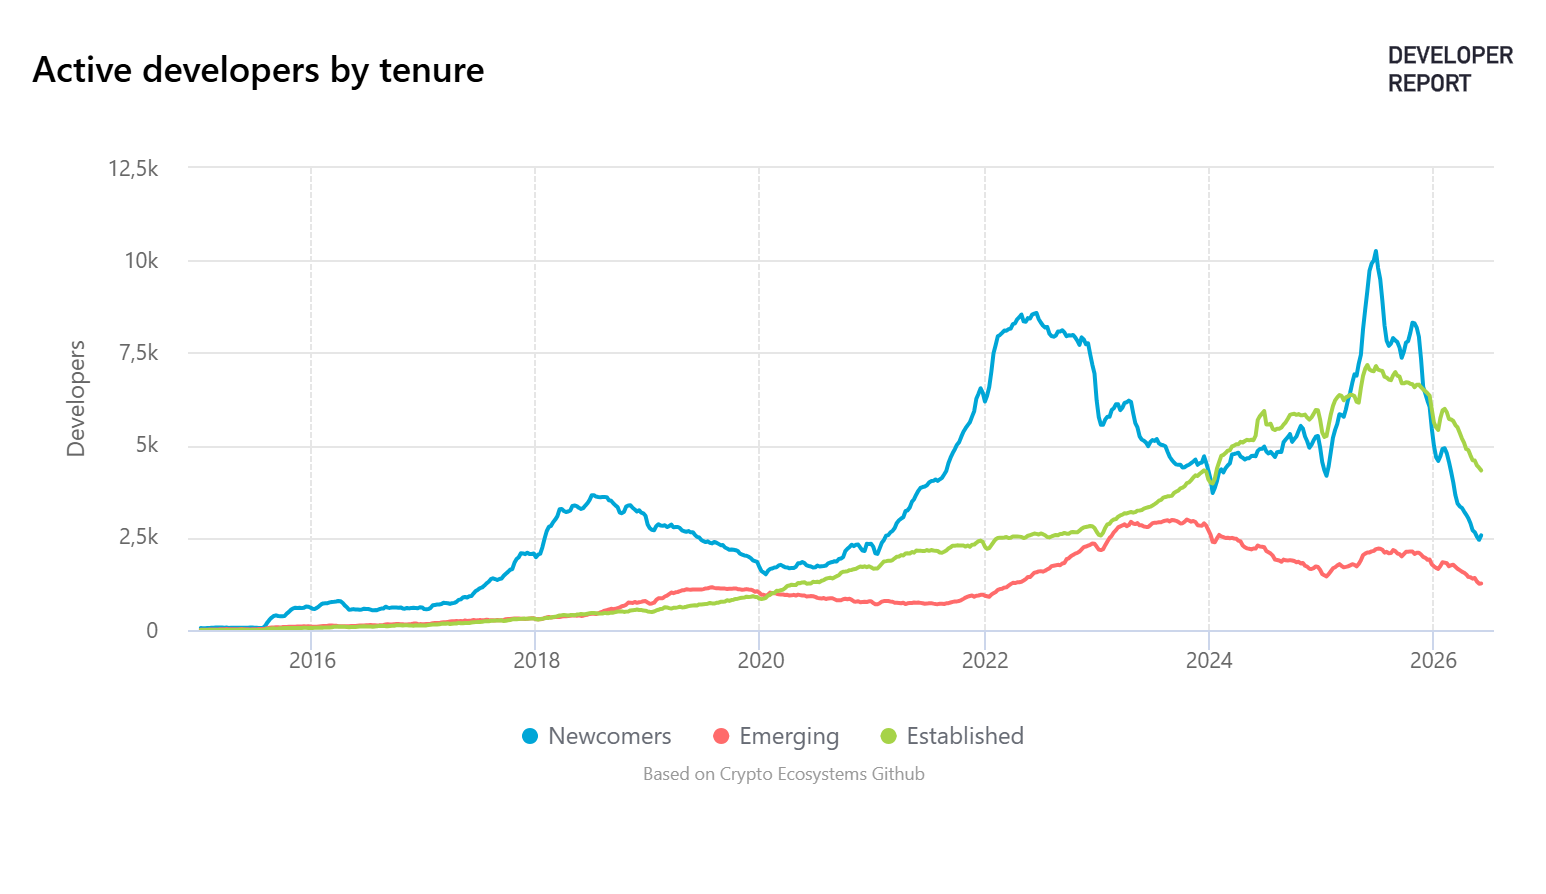
Critical Observation: The developer correction mirrors price — it is a normalization from an unsustainable speculative peak, not a structural deterioration. The core full-time developer base building Ethereum remains intact and active. This is one of the strongest long-term bullish signals available.
Part 5: Author's Critical Opinion — What the Data Is Actually Telling You
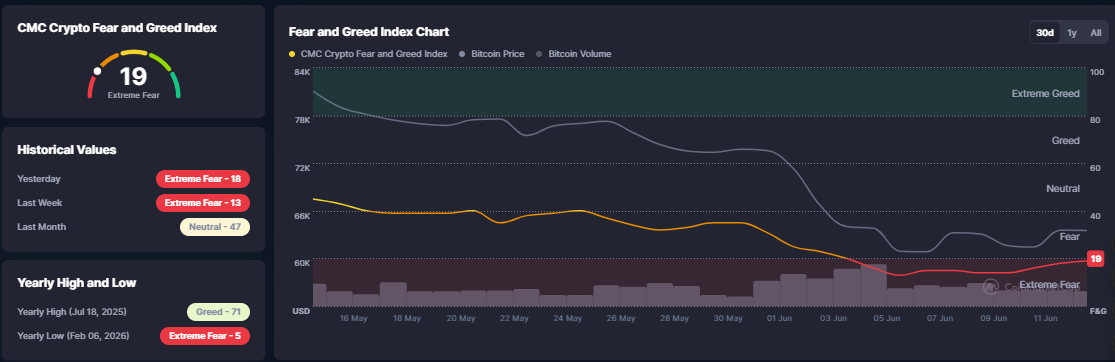
Let me be blunt: the current market narrative around Ethereum is almost entirely driven by short-term fear, not long-term fundamentals.
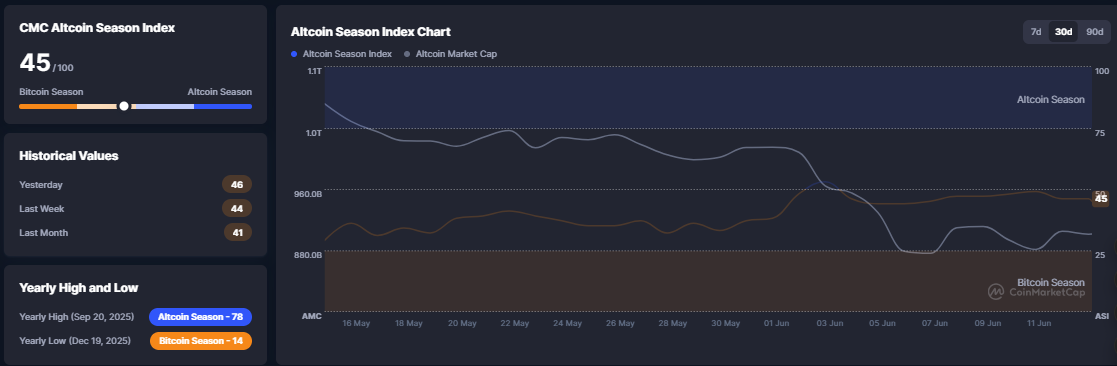
The bears will point to the broken ascending triangle, the declining Altcoin Season Index, and the falling price. They are not wrong about the short-term technical setup — ETH could absolutely test $1,383 or even $875 if broader market conditions deteriorate further. Anyone who tells you otherwise is either lying or guessing.
But here is what the bears are ignoring:
• A Fear & Greed index of 19 has historically represented generational buying opportunities, not sell signals.
• Zero cycle-top indicators triggered out of 30 means we have NOT seen a bubble top in this cycle. The cycle is ongoing.
• Ethereum's network transaction volume has NOT collapsed alongside price — the blockchain is still being used.
• Full-time developer activity remains structurally elevated vs. any prior cycle — real builders are still building.
The market is currently pricing ETH as if the project is dying. The fundamentals say it is not. That gap between price and reality is where opportunity lives — for those with patience and a long enough time horizon.
My verdict: ETH at $1,663 is a speculative accumulation candidate for long-term investors who accept significant volatility risk. This is NOT a call to buy aggressively right now. It is a call to pay attention, do your research, and consider building positions gradually if the thesis aligns with your risk tolerance. The technical picture must confirm the fundamental setup before this trade makes sense for the majority of retail investors.
Conclusion: Patience Is the Edge
Ethereum in June 2026 presents one of the most fascinating risk/reward setups in recent memory. Price is down, sentiment is crushed, and the crowd is selling. But beneath the surface, the fundamentals are holding — and in some cases, quietly improving.
The key takeaways from this analysis are:
• Technical: Bearish in the short-term. Watch $1,383 as the next critical support. A recovery above $1,814 would shift the narrative.
• Sentiment: Extreme Fear (19/100) and Altcoin Neutral (45/100) suggest the market is deep in fear — historically a contrarian opportunity zone.
• On-Chain: Puell Multiple (0.641) signals undervaluation. Network activity remains stable. Cycle-top indicators show 0% trigger.
• Developers: Full-time builder count remains structurally robust — the protocol is not being abandoned by the people who matter most.
The crypto market has always rewarded those who can see clearly when others are panicking. Whether this is Ethereum's final capitulation or just a waypoint on the road to further lows, the data-driven investor will be better positioned than the emotional one.
Stay patient. Stay informed. And always, always manage your risk.
DISCLAIMER
This article is for educational and informational purposes only. It does not constitute financial advice. All investments in cryptocurrencies carry significant risk. Past performance is not indicative of future results. Always do your own research and consult a qualified financial advisor before making any investment decisions.