.png)
Created On Canva Pro---
Assalamu Alaikum friends,
Hope everyone is well and healthy. Bitcoin is currently going through its critical price zone. Due to this, those traders are in trouble. Because, trading in crypto is completely dependent on the price of Bitcoin. When Bitcoin's price movement cannot be accurately predicted in which direction it will go, trading becomes impossible or the possibility of loss increases. As a result traders face losses. Hence, traders trade off in such situations to avoid such losses. However, among these are the new traders who get caught trading by mistake. By this they lose their capital and become destitute. So in today's blog, I will try to find out what could be the next movement of Bitcoin. Hope you will like the whole blog. Let's start without delay:-

[Screenshot From Binance](https://www.binance.com/en/trade/BTC_USDT?_from=markets&type=spot)
Before starting the blog, let's mention the current price of Bitcoin. In the last 24 hours, Bitcoin reached a high of $67,349 and a low of $66,060 with a volume of $22,260,745,760. This type of price movement of Bitcoin is not stable. Sudden pumps and sudden dumps are occurring. By doing this it is not possible to find out the specific movement of Bitcoin.
[Screenshot From Binance](https://www.binance.com/en/trade/BTC_USDT?_from=markets&type=spot)
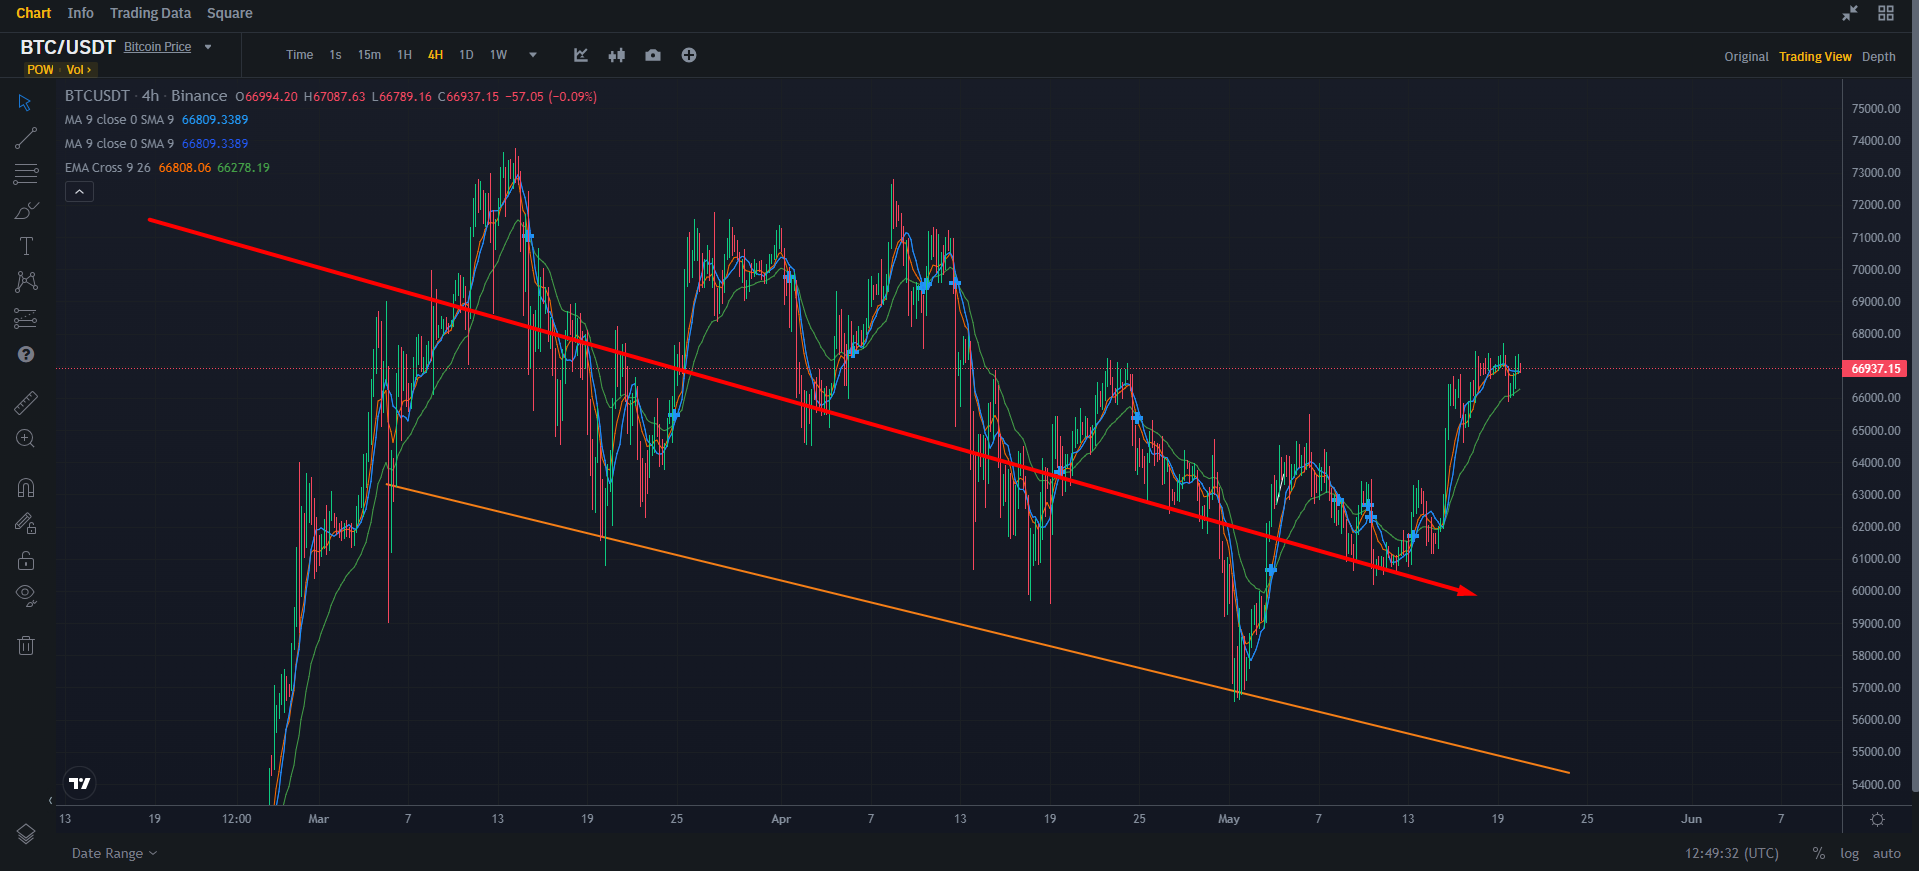
To properly analyze the movement of Bitcoin, long-range candlesticks should be analyzed. Only then will it be possible to figure out Bitcoin's next movement effortlessly. Let's start the analysis with a 4-hour candle. As we can see in the screenshot above, Bitcoin has been in a downtrend on the 4-hour candle since it touched its all-time high, creating a new all-time high. This downtrend was so big that it dumped the price of Bitcoin from $73,500 to $56,500 in a very short period of time. But then the price started to move upwards by breaking the resistance little by little through the sideways move.
[Screenshot From Binance](https://www.binance.com/en/trade/BTC_USDT?_from=markets&type=spot)
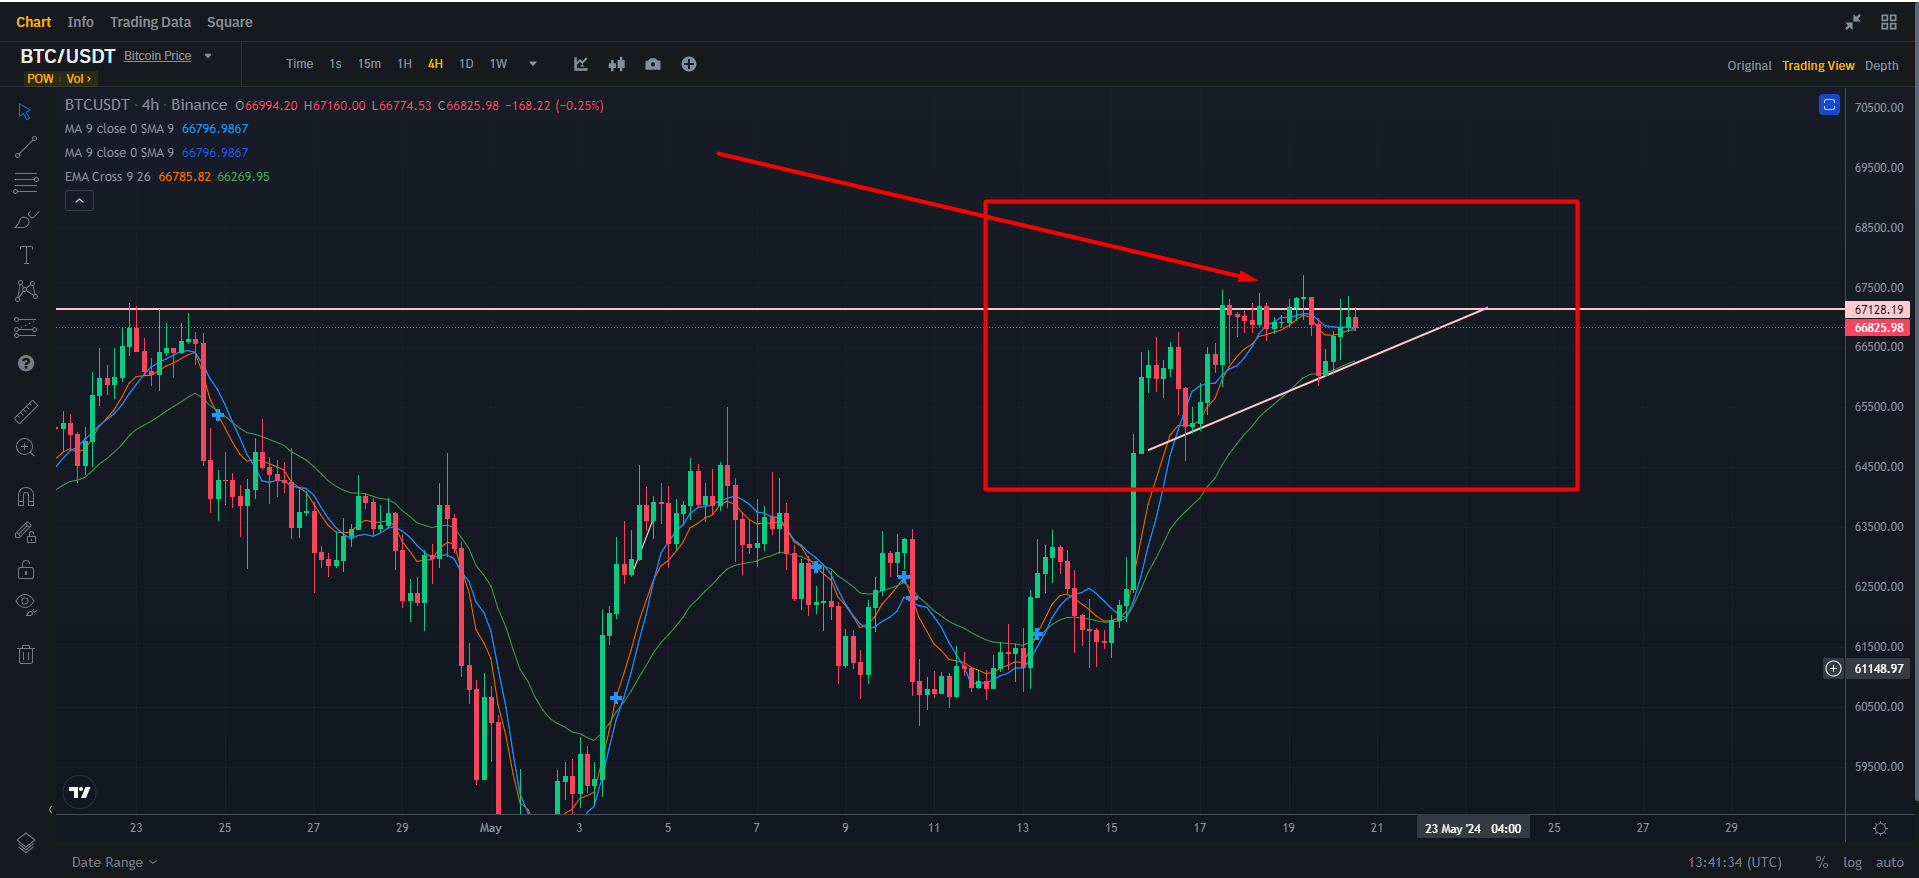
Again in this screenshot we can see that Bitcoin is stuck at strong resistance. If Bitcoin can break this resistance, it will see movement in huge prizes. It is assumed that the upcoming bull market will be confirmed through this break out. So, all traders should wait for this breakout.
Published On:- 20 May, 2024
VOTE @bangla.witness as witness
OR
SET @rme as your proxy
Thanks