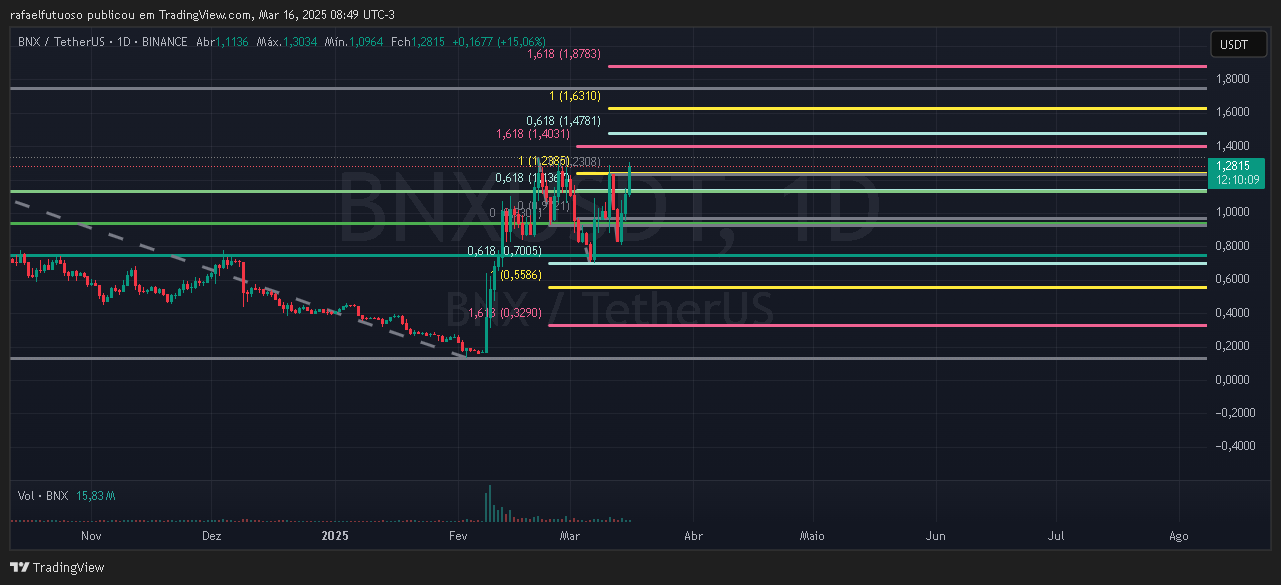
Bullish Fibonacci:
0.618 ($1.618): A classic Fibonacci extension target, indicating significant upside potential if the breakout holds.
1.0 ($1.8783): Full extension of the previous move, suggesting a more ambitious target.
These levels indicate that if momentum continues, BNX could aim for $1.618 as the next key target, with $1.8783 as a long-term objective.
Bearish Fibonacci:
0.618 ($1.136): A key support level in case of a correction after the breakout.
0.382 ($1.3290): Interestingly, this level is very close to the top of the volatility range ($1.3333), reinforcing it as resistance.
0.0 ($0.3920): The base of the move, marking the previous correction low (February 2025).
3. Critical Levels on the Chart
Resistances:
$1.3333 (top of the volatility range, aligned with the bearish 0.382 Fibonacci).
$1.618 (bullish 0.618 Fibonacci).
$1.8783 (bullish 1.0 Fibonacci).
Supports:
$1.2408 (base of the volatility range).
$1.136 (bearish 0.618 Fibonacci).
$1.000 (psychological support and level tested in March).
4. Recent Price Movement
BNX dropped to $0.3920 in February (bottom of the move) before rallying to $1.2522, as anticipated by some TradingView analyses. Now, after breaking the previous high, it stands at $1.2875, testing the upper range.
The "Three White Soldiers" Pattern
Between March 12-14, a potential “Three White Soldiers” formation appeared (three consecutive green candles), leading to the breakout.
Testing $1.3333: The price is just cents away from the top of the volatility range ($1.3333), which also aligns with the bearish 0.382 Fibonacci ($1.3290). If broken with volume, BNX could aim for $1.618 (bullish 0.618 Fibonacci) before the suspension—a +25% move from $1.2875.
Breakout Strength: The pivot at $1.2744 and breakout above $1.2522 suggest bulls are in control. If volume increases, $1.3333 may just be a stop before higher targets.
Bearish Scenario
Rejection at $1.3333: This area could form a triple top (previously tested in February and early March). A rejection could lead to a pullback toward $1.2408 (volatility range base) or even $1.136 (bearish 0.618 Fibonacci), a 6-12% decline.
Suspension Driving Selling Pressure: Traders might take profits before March 18, especially if the price reaches $1.3333, increasing the risk of a pullback.
8. My View (Technical Curiosity)
The breakout above $1.2522 and pivot at $1.2744 are strong bullish signals. The current price of $1.2875 is well-positioned to test $1.3333 in the next few hours, especially with the "Three White Soldiers" pattern.
Your Fibonacci projections are well-placed:
Upside: $1.618 is a reasonable target in a bullish run, but unlikely before March 18 due to time constraints and resistance at $1.3333.
Downside: $1.136 and $1.2408 are solid support levels if a correction occurs, potentially after the suspension if the hype fades.