Steemit is where we blog and interact. It's a blockchain that powers these activities we do. The native cryptocurrency of the steemit platform is Steem. When users post, comment and get curated, they earn Steem. In this article, I will be analysing the STEEMUSDT chart.
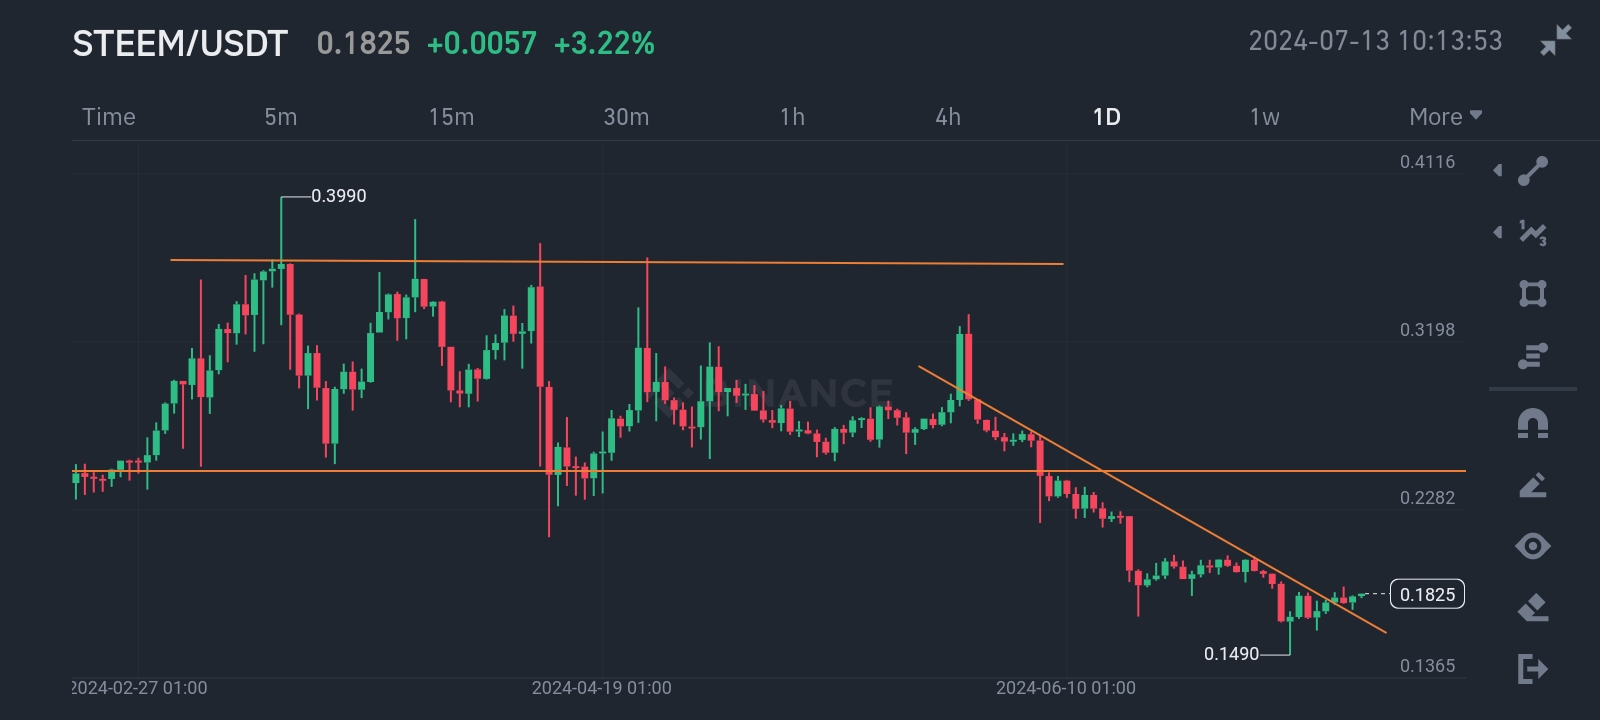
**STEEMUSDT 1 Day Chart [Adapted from Binance]**
The STEEMUSDT chart is a really interesting one. At first glance, you can see that the market was initially a ranging market. This means that the price kept going up and down between two points, which I indicated with two horizontal lines. There really was no definitive uptrend or downtrend.
The price would go up and once it reaches the upper line (around $0.36), it would get resisted at that point. This means that sellers came in and drove the price back down.
On going down, it would get to the lower line (around $0.24), which served as support, and bounce back up. So buyers came in at that point and drove the price up.
This back and forth continued for a while and traders can take advantage of it. So whenever the price got to the upper line, a trader can place a sell order, because there is a very high probability that the price will go down. Conversely, whenever price fell to the lower line, a trader could place a buy order because there is a high possibility that the price will find support and push back up.
Along the line, the price started going sideways. It wasn't going up or down, it just went horizontally. This is called consolidation and it indicates indecision in the market. Next thing, there were two big candles, a green one and a red one, and what followed next was a downtrend. The lower support was broken, and there was a downfall in price. You can see the trend line I drew, trying to emphasize the downtrend.
However, recently, the downtrend seems to have come to a halt and it looks like an uptrend is about starting. You can see at the tail end of the chart how the price seems to have crossed the trend line, gradually making its way up. As at the time of this analysis (13th July), the price of Steem was at $0.18. I expect a further but gradual rise in price, until it probably gets to the the lower horizontal line which previously served as support.
To understand better what is happening recently on the chart, let us take a look at the 4 Hour chart.
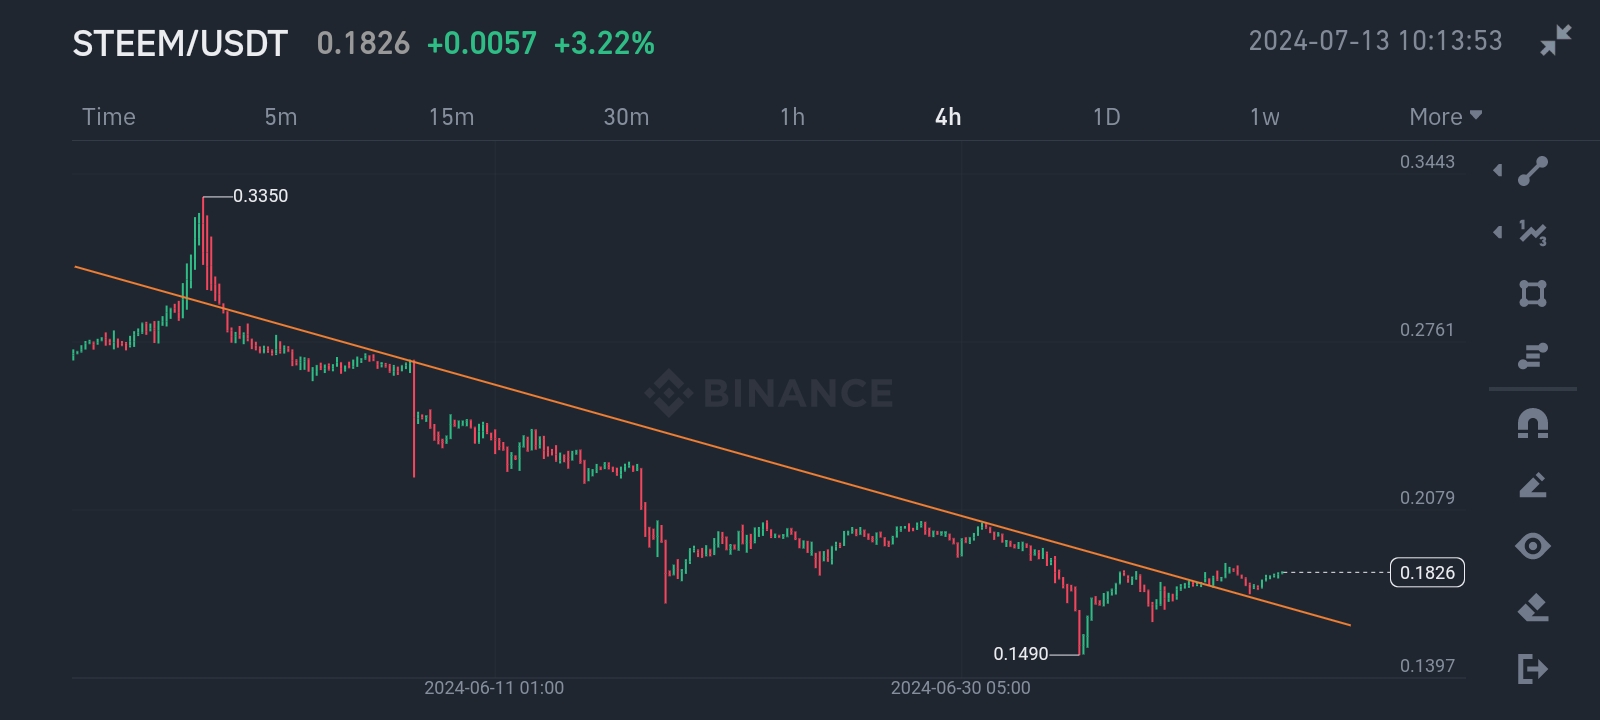
**STEEMUSDT 4 Hour Chart [Adapted from Binance]**
Here, you can see better the down trend that happened recently. I drew the trend line, connecting the tops, to see how far the downtrend would go and when a break out would occur. It obvious that the fall in price was not steep, it's something that gradually. However, if you look closely, you will see that a break out is starting, and the price is about to go back up.
That's it for my analysis of the STEEMUSDT chart. I do hope you enjoyed it.
*Note: This article is not a financial advice*