Bitcoin is often referred to as the major cryptocurrency. Other cryptocurrencies are usually referred to with a general term, Altcoins. Lately, we've seen the price of Bitcoin drop. This drop has been attributed to several events happening in the crypto world. However, within the last 48 hours, there has been a sharp increase in the price of Bitcoin.
Let us analyse the chart to have an understanding of what is going on with the price of Bitcoin.
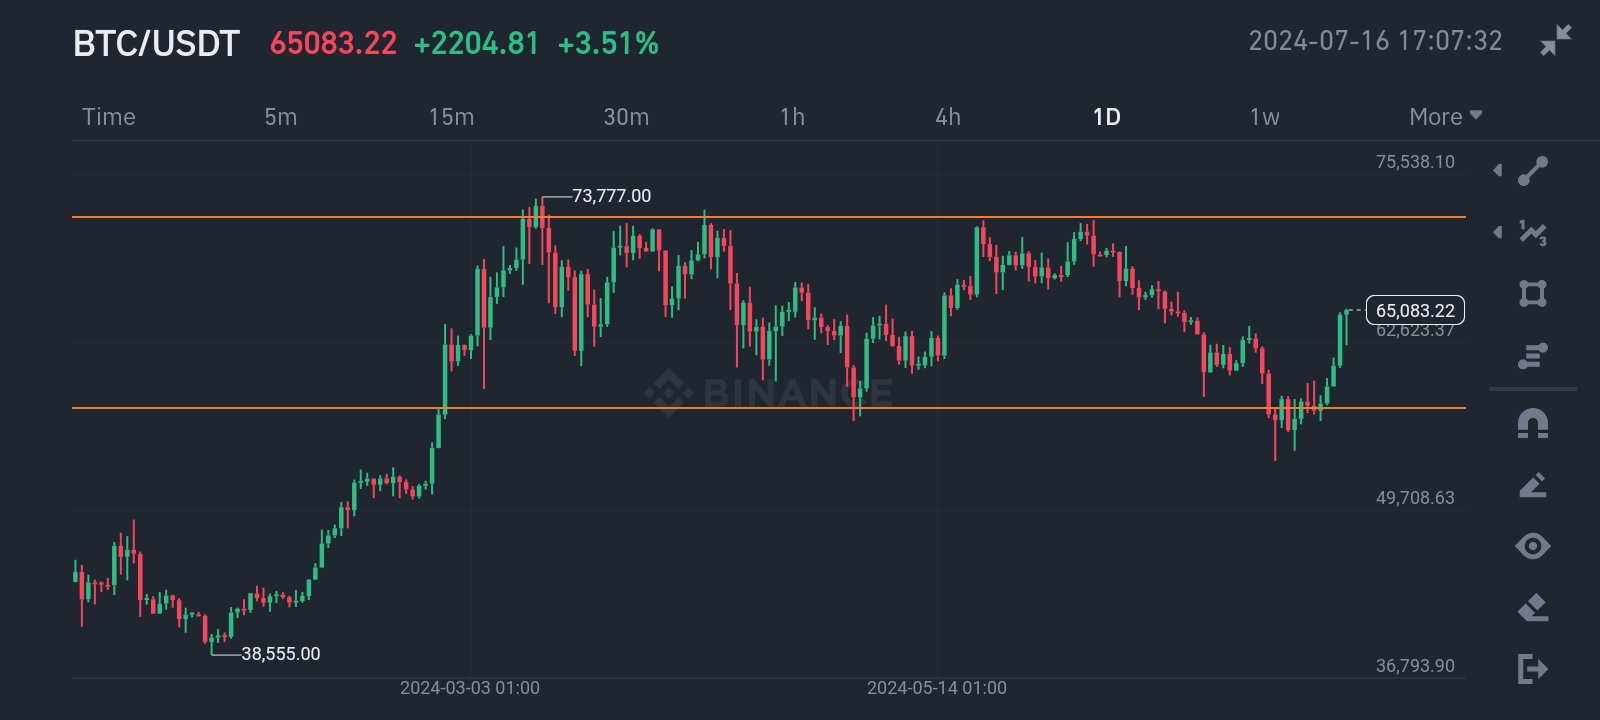
**BTCUSDT 1 Day Chart [Adapted from Binance]**
From the 1 day chart, you can see that there was an initial uptrend. The price of Bitcoin saw a steady rise until it got to a certain point (which I indicated with a upper horizontal line). This point (around $72,000) served as resistance and pushed the price back down. While going down, any time it approached a certain region (which I indicated with the upper horizontal line around $57,000), the price bounced back up. So this region served as support.
If you observe closely, you can see that the price kept fluctuating between both points. Those are two important points in the BTC price chart because they serve as strong support and resistance zones. So in other words, whenever the price got to the upper line, the buyers sellers would swoop in and drive it back down. Conversely, whenever price approached the lower line, the buyers would swoop in and push it back up.
This created a ranging market, meaning that price was just going up and down between those two points; there wasn't really any definitive uptrend or downtrend. Traders can take advantage of such a market in the sense that they can place a sell order when the price reaches the upper resistance point, since it is most likely that a fall in rice would follow. On the other hand, they could place a sell order when price approaches the lower support point, as the price would most likely go up again.
Very recently, the price hit the support region, and it is currently on a swift rise. The price of Bitcoin as at the time of this analysis (16th July) was $65,083. I expect it to go higher until it gets to the resistance zone where I predict it will face a push back.
To understand better the recent happenings in the BTCUSDT chart, let us take a look at the 4 hour chart.
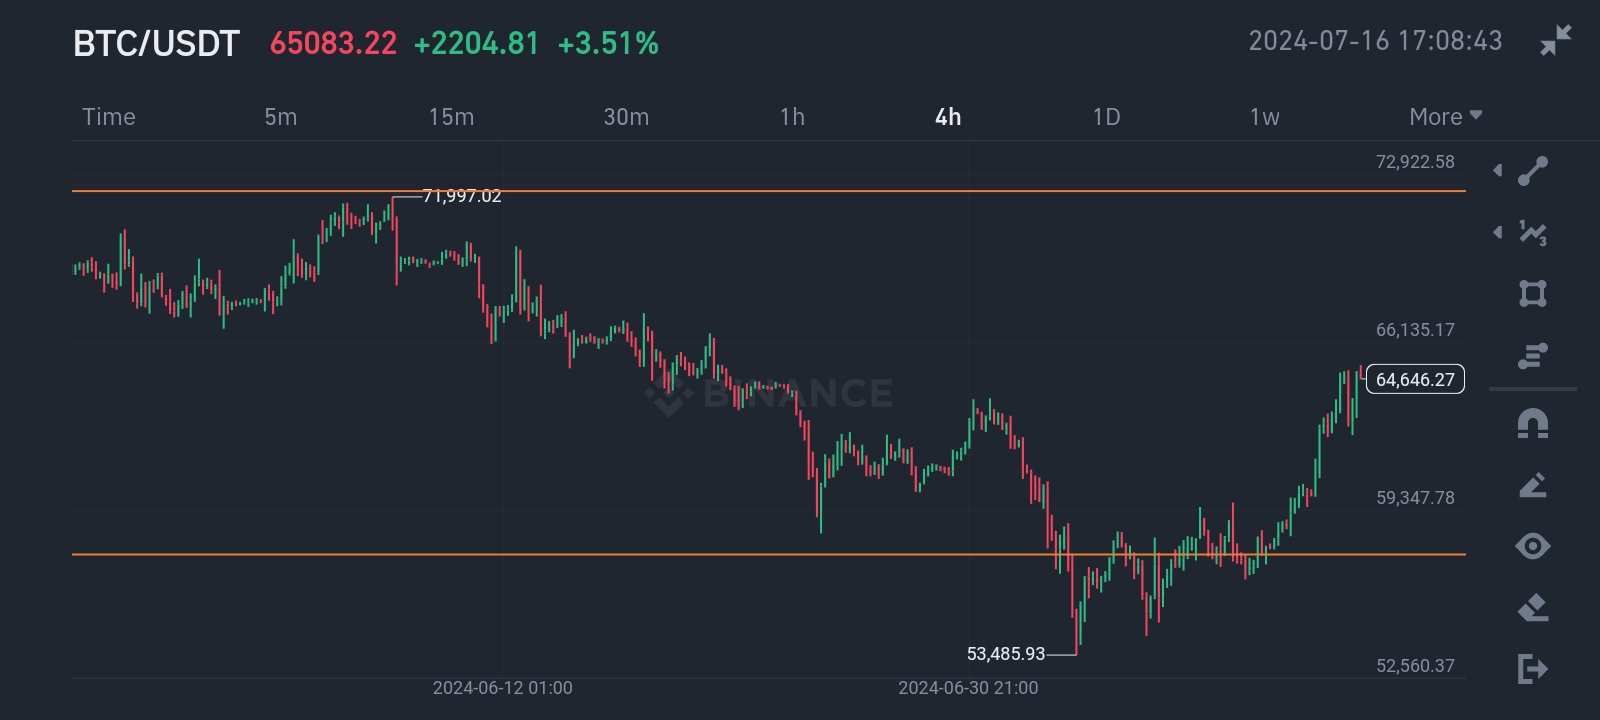
**BTCUSDT 4 Hour Chart [Adapted from Binance]**
At first glance, it seems like there was a downtrend. But this was basically a case of the price going down after being resisted. As it got to the support zone, the price started its way back up. Like I mentioned earlier, I expect the continuous rise in the price of BTC until it gets to the $72,000 range. Once it gets there, traders have to be careful because two things could happen. BTC price can get resisted back down, or it could break the resistance and continue on its way up.
That's it for my analysis. I do hope you enjoyed it.
---
*Note: This article is not a financial advice*