Arbitrum is a layer 2 tech built on the Ethereum Blockchain. ARB is the native token that is used in Arbitrum for activities.
Now, let us get into the analysis proper.
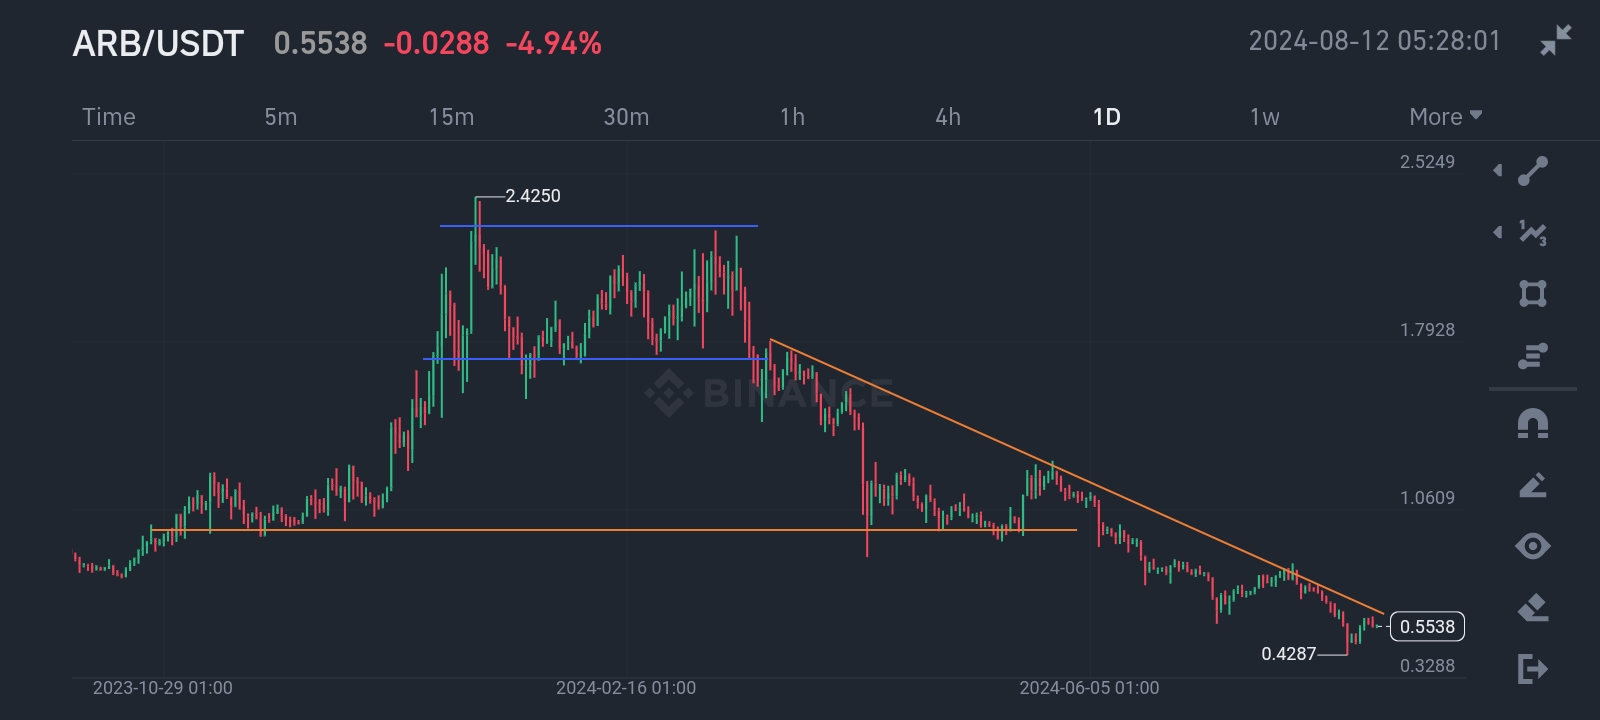
**ARBUSDT 1 Day Chart [Adapted from Binance]**
The price of ARB has been on a downtrend lately. Initially, there was a slight uptrend, then it started consolidating and going sideways on the horizontal orange line which I drew to signify this point. This point indicated by the horizontal line (around $0.97) is significant because everytime price gets there, it consolidates, showing that there is indecision in the market at that point, and the buyers and sellers are in equilibrium.
After consolidation, the uptrend continued. The pride rose up until it got to its peak at $2.42. After that, it started ranging. What this means is that it was just going up and down between two points. It wasn't really in a well defined uptrend or downtrend. Your can see that I drew an upper blue line (around $2.29) and a lower blue line (around $1.7) to mark the two points between which the price kept ranging. Whenever the price got to the lower blue line, it would bounce back up. Similarly, whenever price approached the upper blue line, it would fall back down.
Eventually, the price broke out and started a downtrend. It fell until it got to the orange horizontal line where it consolidated again, probably trying to find some support, but eventually it continued on a downtrend. You can see that the price has been falling for a long period of time now. I expect it to find support somewhere at $0.4 and bounce back up, especially as the general condition of the crypto market is starting to get better.
There are several spots of interest on this chart for traders. The first is the point where the price was ranging. Traders could buy when the price got to the lower blue line knowing that it will most likely go back up. Likewise, traders could sell when the price approached the upper blue line, knowing the price will most likely be pushed back down. Also, traders have to be careful around points of consolidation, because price could go anywhere from there.
*Let's take a look at the 4 hour chart to have a better picture of the recent events in price movement.*
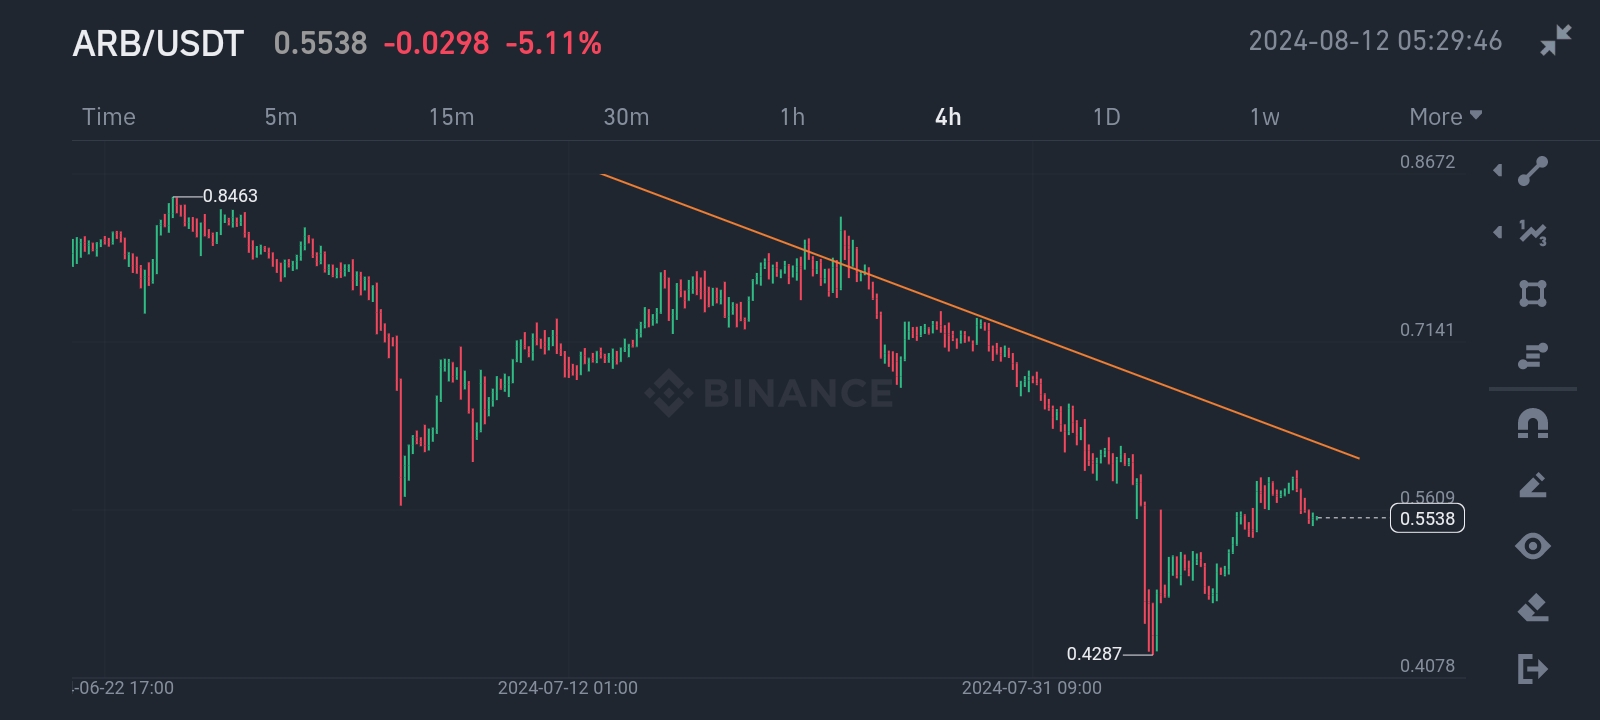
**ARBUSDT 4 Hour Chart [Adapted from Binance]**
You can see how there was a downfall in price. However price seemed to be going upwards a little. But when it touched the trend line, it went down again. As it stands, it looks like the price is approaching the trend line again. We just have to wait and see what happens when it gets there. It could either break out or continue in the down trend.
That's it for my analysis. I do hope you enjoyed it.
***Note: This article is not a financial advice.***