XRP is the native cryptocurrency of the XRP ledger, which is a blockchain. XRP has been associated with the crypto company, Ripple, which uses XRP for several activities. It is one of the popular cryptocurrencies, and it has held its own in terms of price over time.
Now let's get into the analysis.
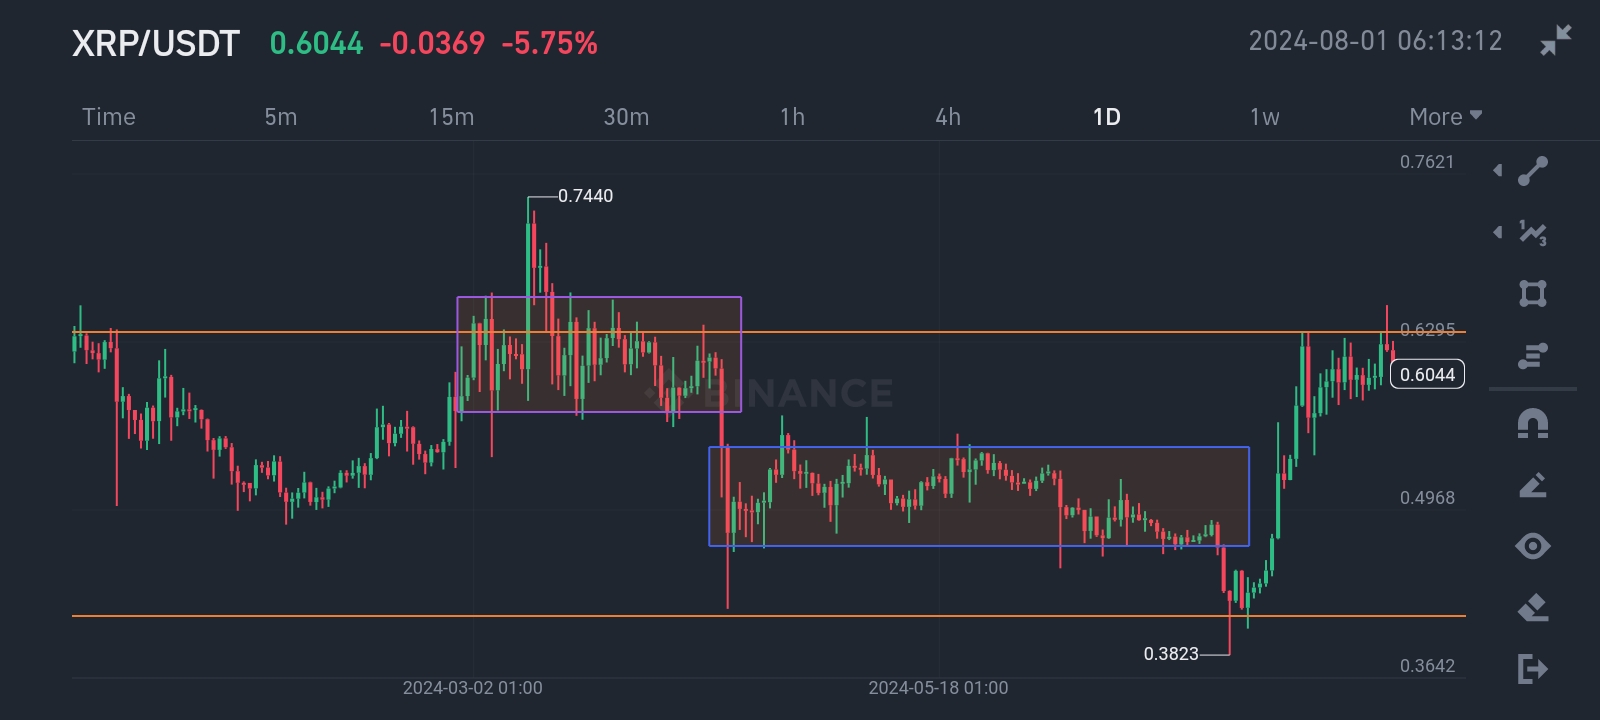
**XRPUSDT 1 Day Chart [Adapted from Binance]**
The XRPUSDT Chart is an interesting one. There are multiple things going on that are important to point out. You can see the two orange lines I drew to indicate significant points in the chart. Initially, the price was going down from the upper orange line. You can tell that the price was resisted from that point.
It's obvious that the upper line (which was around $0.6) served as resistance. Price fell and then took a U turn, making its way up. It got to the upper line again and started consolidating. This means that the price was just going sideways, even if it broke the resistance once and got back. I indicated this consolidation region with a purple box. There was indecision in the market as price neither went into an actual uptrend or downtrend.
Eventually, the price gave in to the resistance it faced at that upper line and it went down. The price fell until it hit the lower orange line (around $0.4) and then it bounced back up. Then there was another period of consolidation which I indicated with a blue box. Again, this showed that there was indecision as the price just kept going horizontally.
After the consolidation, there was a little drop in price to touch the lower line which served as support and pushed the price back up. There was a massive uptrend that followed. The buyers came in and pumped the price up very hard.
Currently, the price is at the resistance zone, which is indicated by the upper line, and you can see that it appears to be starting a horizontal movement. My guess is that price will consolidate again and face stiff resistance which could lead to a downtrend.
The importance of both horizontal lines is that they serve as critical decision making points for traders. When price hits the upper line, it means there is about to be resistance and a downtrend could follow, so it would be a good opportunity to place a sell order. Likewise, when price hits the lower line, there is the possibility of support and price bouncing back up and traders can place a buy order.
Let us take a look at the 4 hour chart to see better the recent happenings in the 1 day chart.
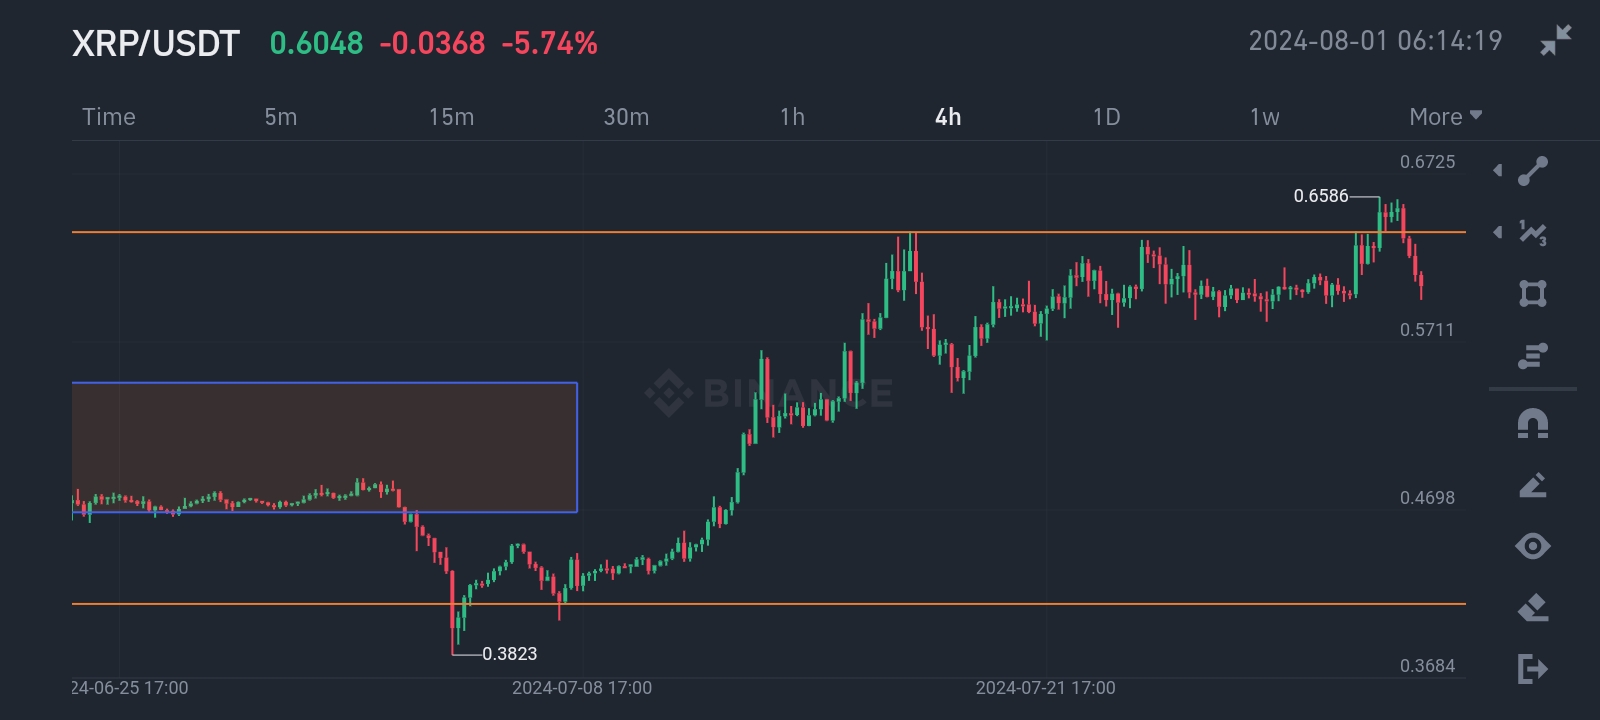
**XRPUSDT 4 Hour Chart [Adapted from Binance]**
You can see that price had just finished consolidating, and fell a little to touch the lower line before picking up and starting an uptrend. However, as soon as it hit the upper orange line, price started going sideways. Like I said earlier, I expect price to fall to an extent from this point.
I do hope you enjoyed my analysis. Thanks for reading.
***Note: This article is not a financial advice.***