
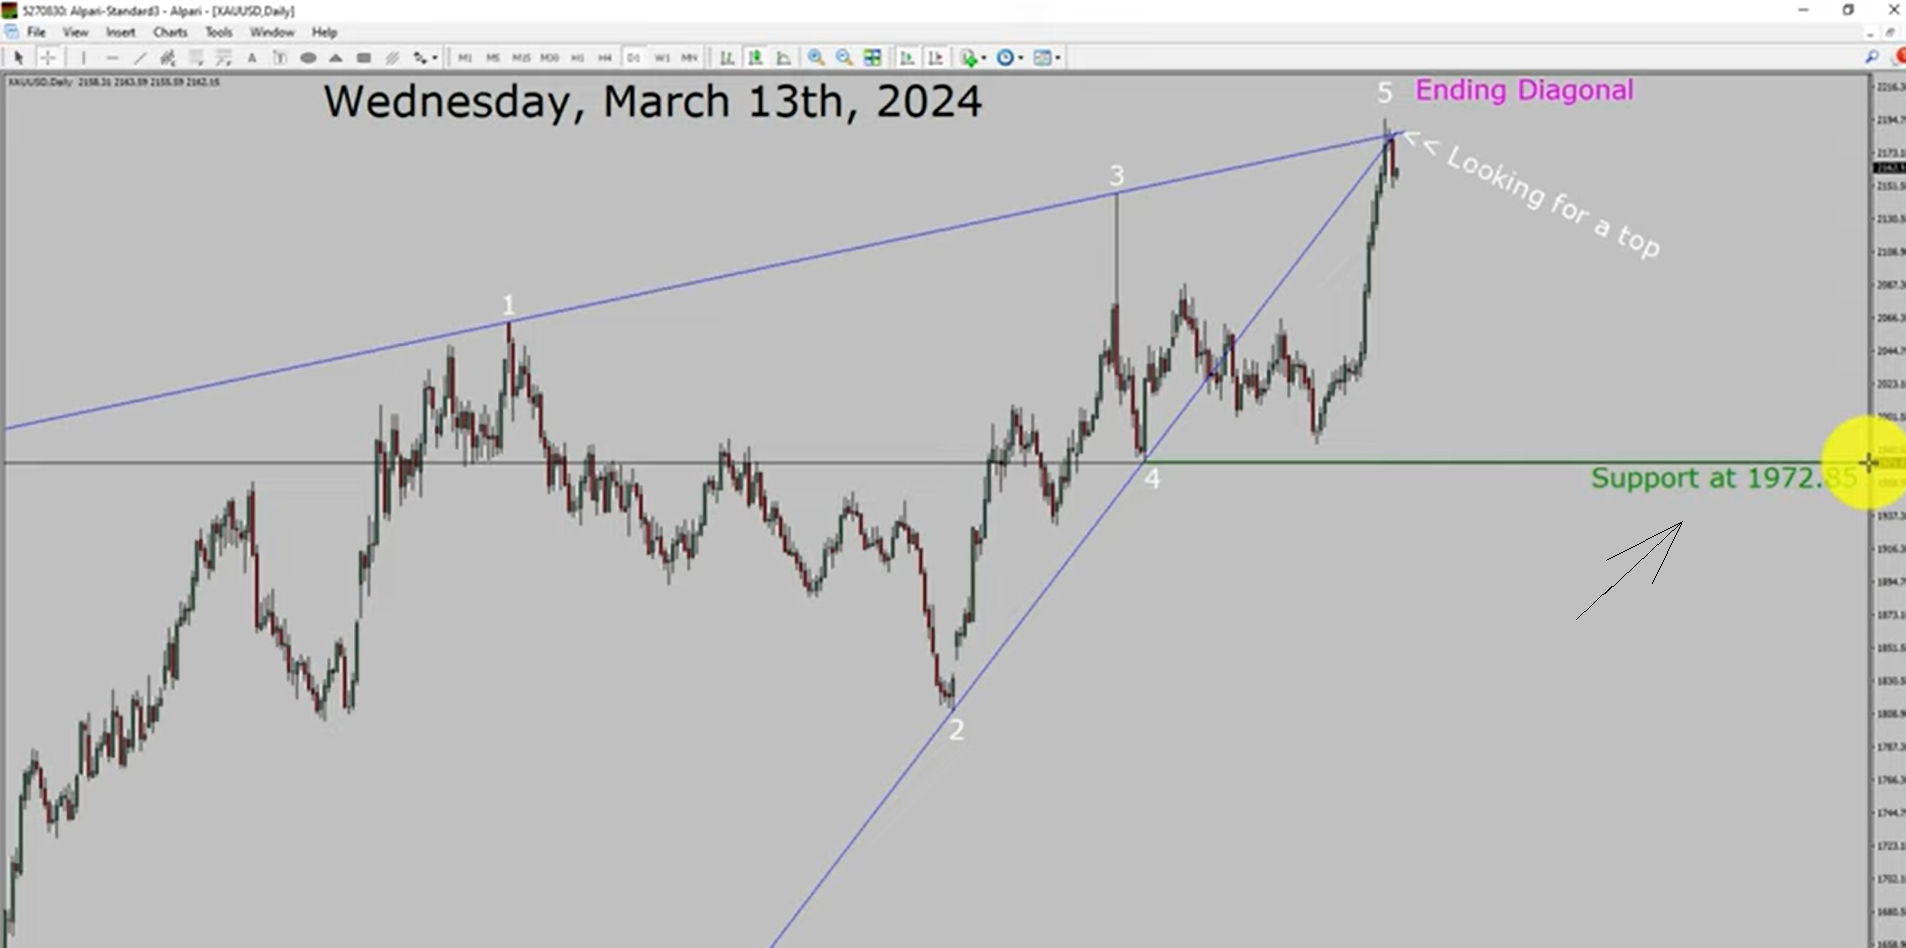
Hello Guys I am going to analyze spot gold versus US dollar pair let us use the top-to-bottom Elite wave analysis inside the daily time frame the trend is up in spot gold daily time frame support is present at 1972. 185$ price level price action is most likely going to print a top and a drop in the coming trading days uh decisive bearish break below 1972. 185$ support area is going to end up Trend in the daily chart of gold versus the US dollar pair
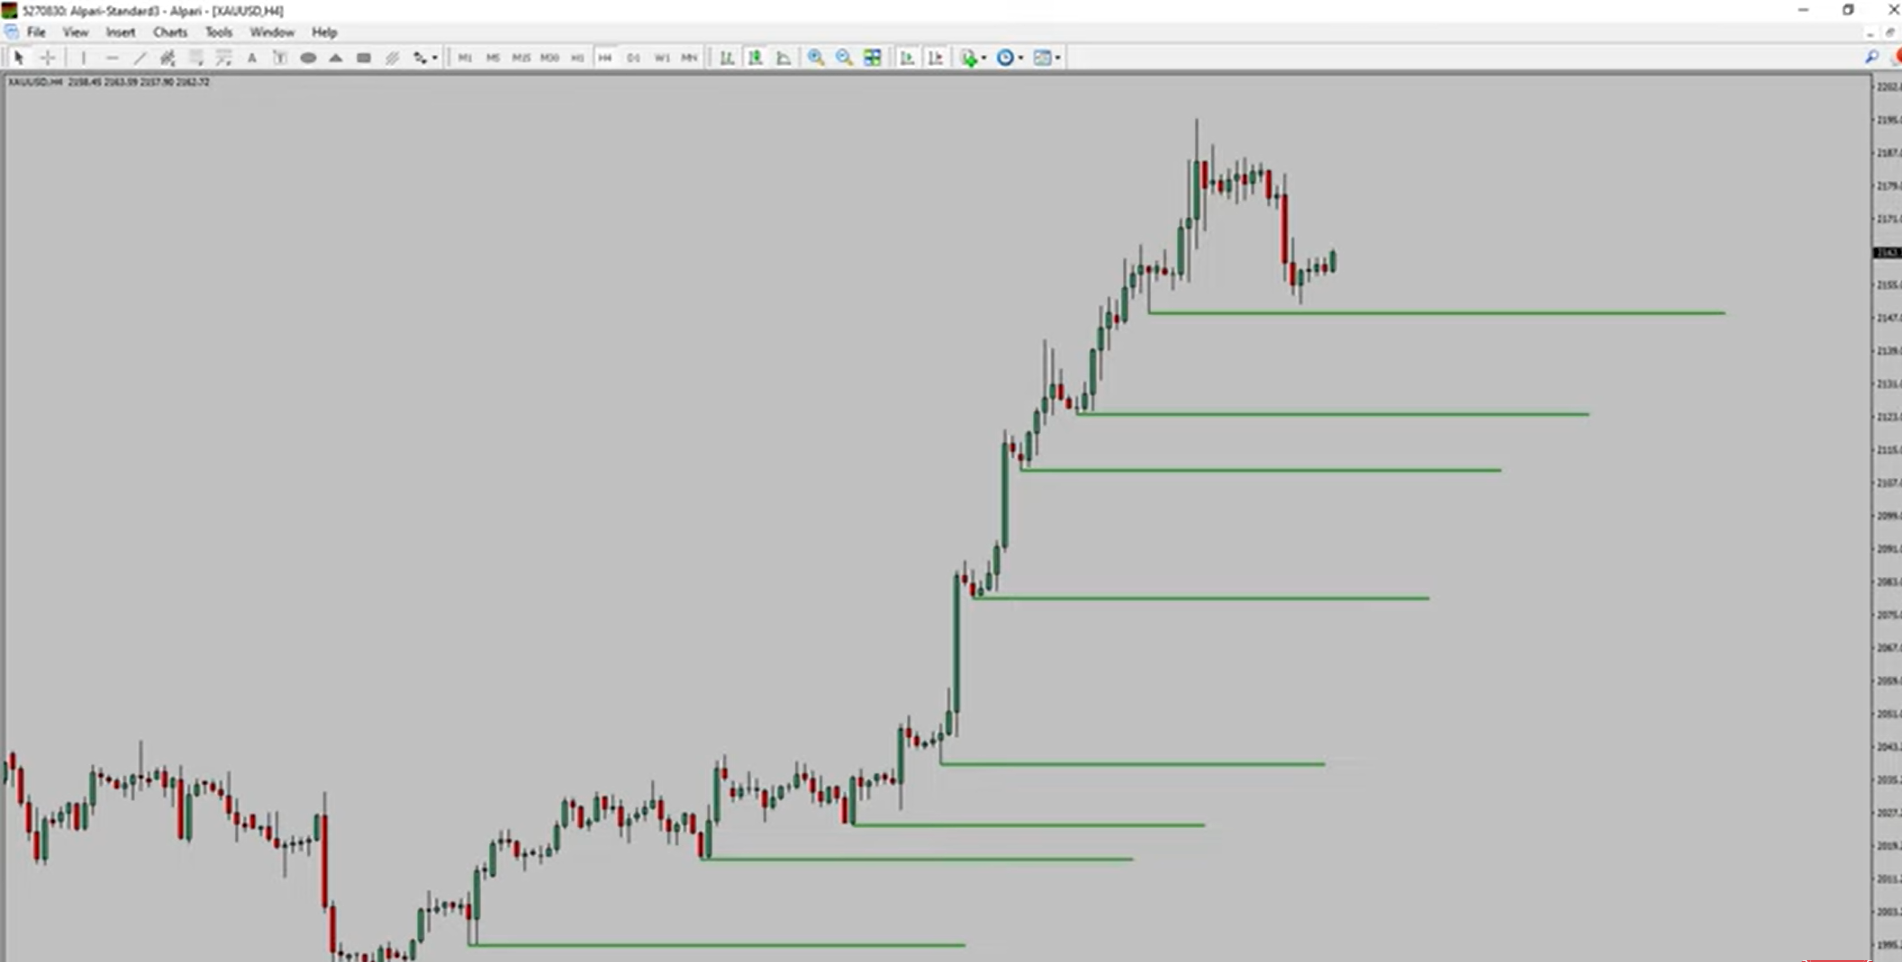
At 4-hour time frame price action is printing higher swing highs and higher swing lows to me spot gold The trend looks up in the 4-Hour time frame
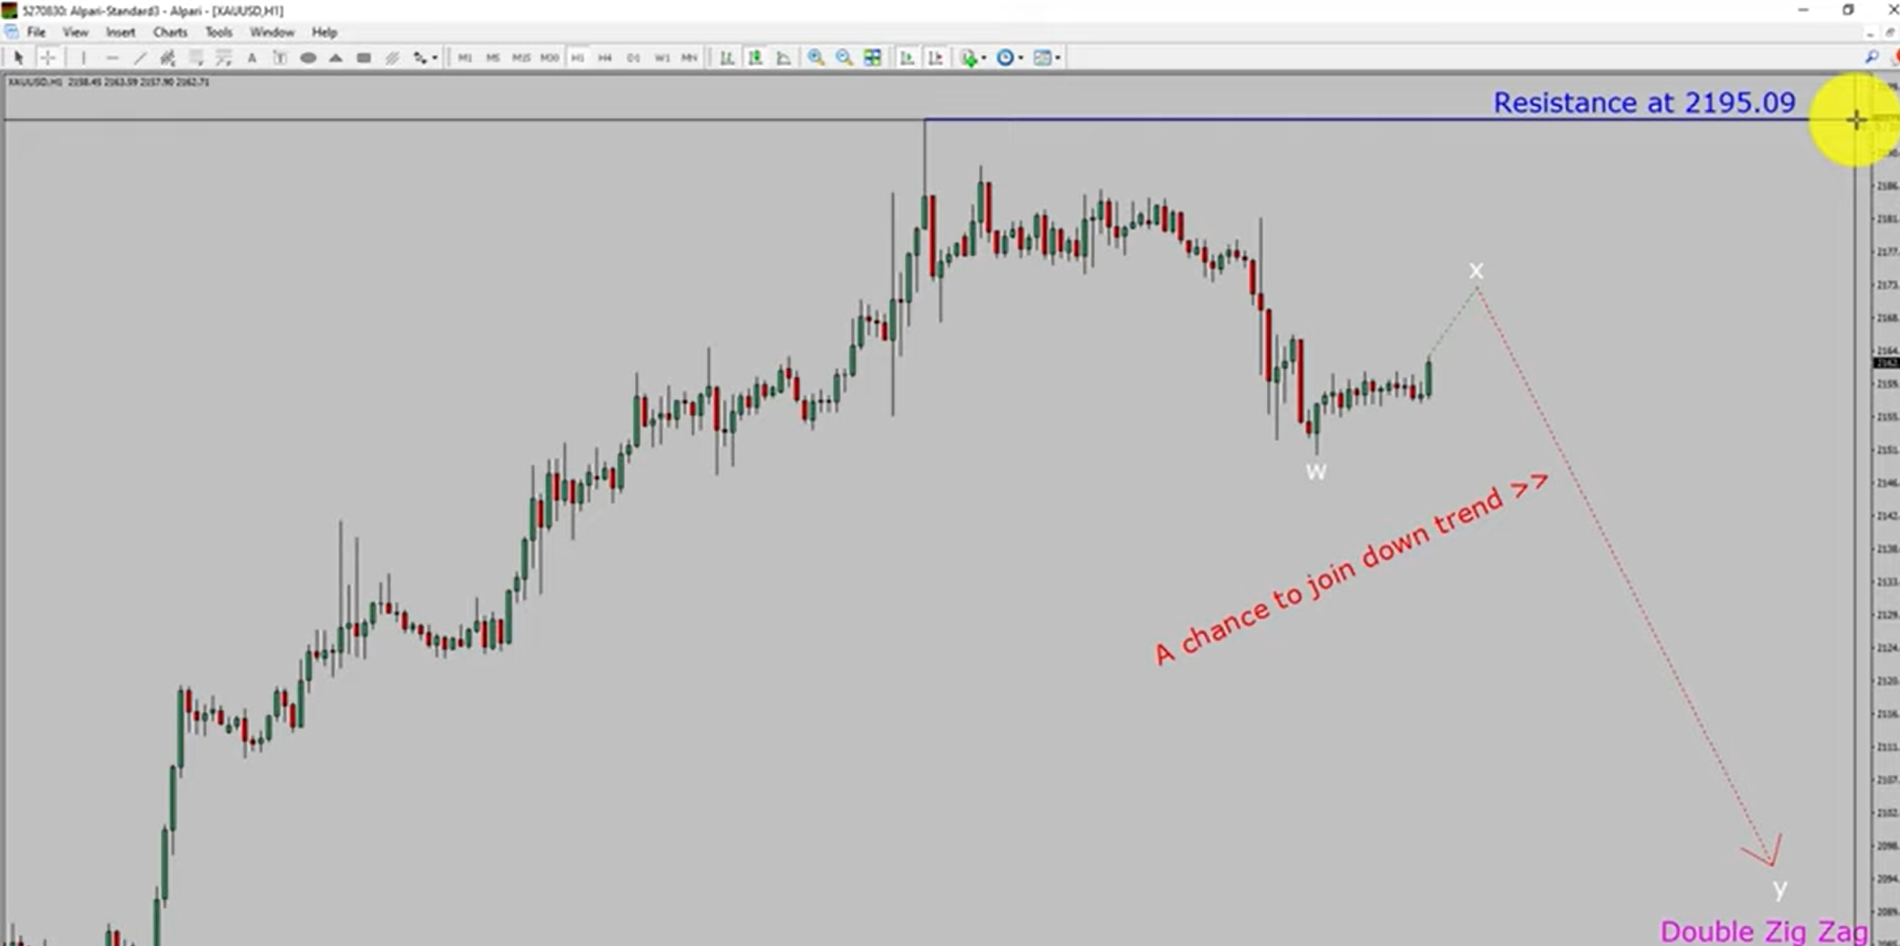
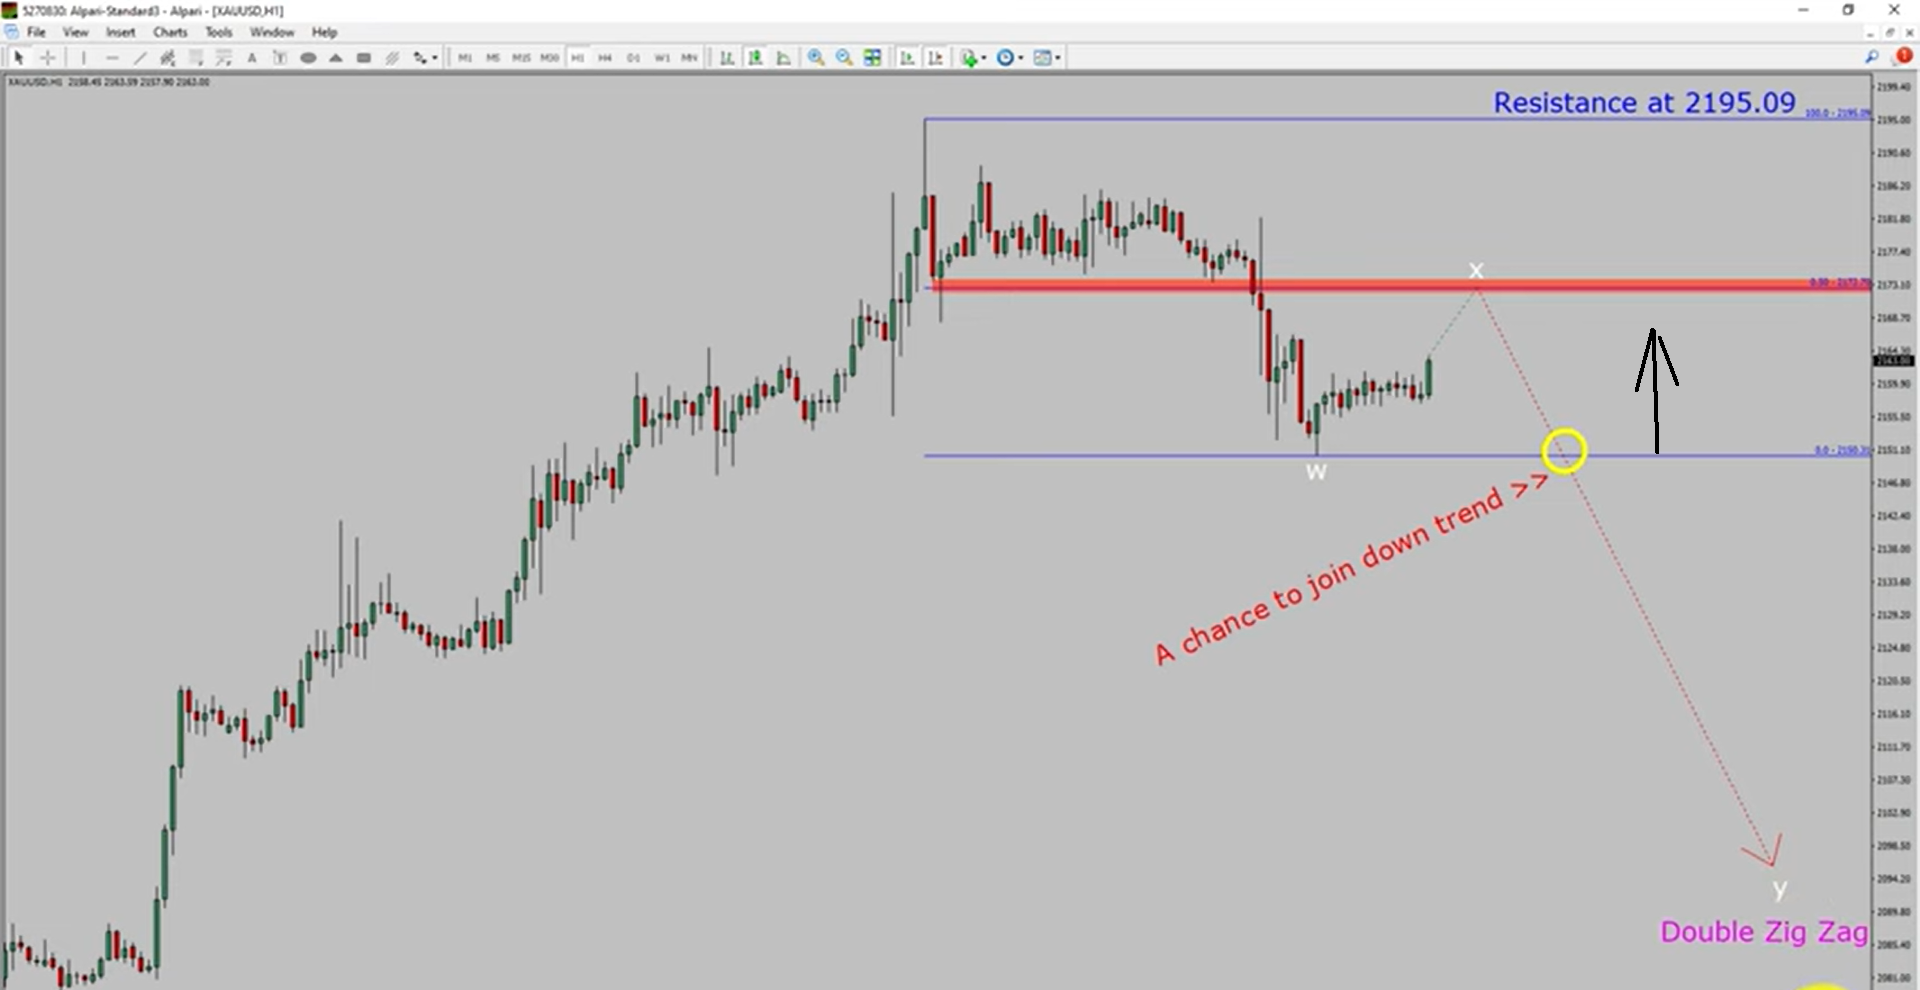
At 1 hour time frame the trend is down in the 1-hour chart intraday resistance is present at 2195.9 price level price action is the most likely going to rise to print a bullish wave X pullback after that I expect a bearish wave y double zigzag leg which offers a chance to join the downtrend in spot gold a decisive bullish breakout above 21959 resistance level is going to end downtrend in one hour chart of gold versus United States dollar pair
specifically the red color highlighted the area offers the selling opportunity which is the previous wave B of one lesser degree do not jump into the market with a sell trade wait for a bearish breakdown First Take note you must always trade with money management rules to control risk