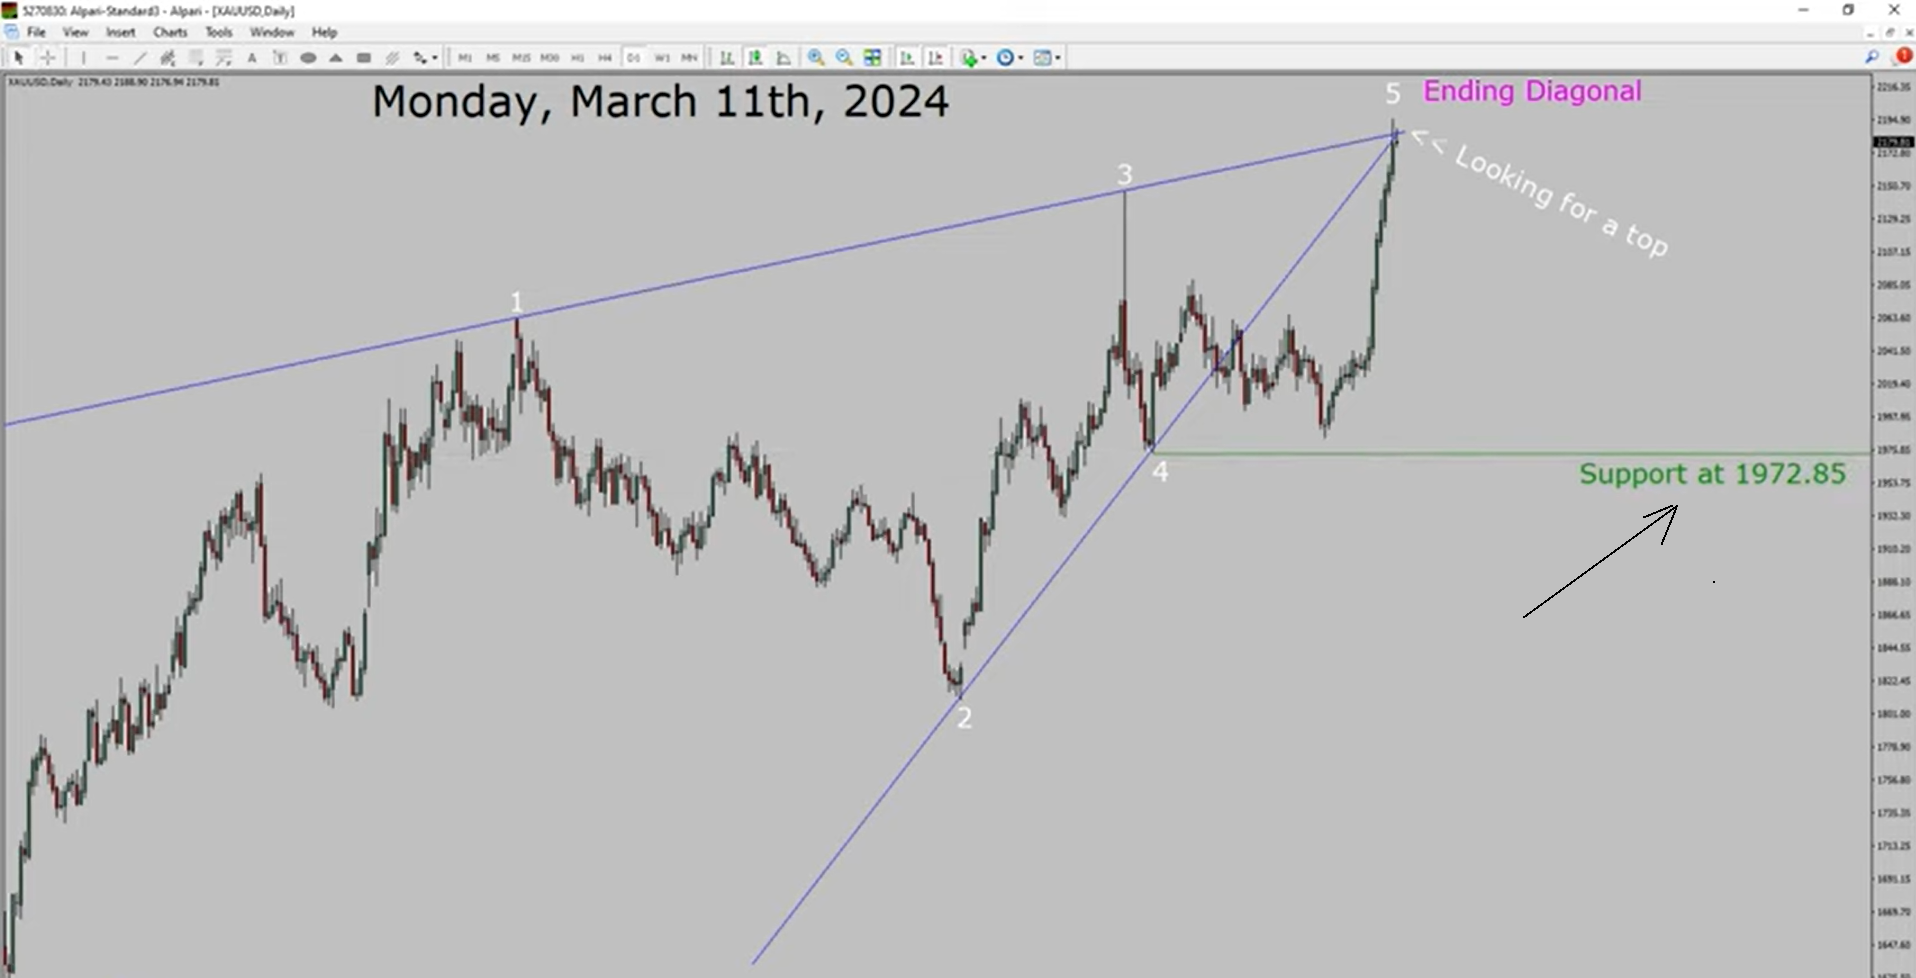
Hello, guys Today I am going to analyze spot gold versus the US dollar pair let us start the top to bottom a l wave analysis inside the daily time frame the trend is up in spot gold daily time frame support is present at 1972. 85$ price level price action is most likely going to complete a bullish wave five motive wave and then I expect a top and a drop in coming trading days a decisive bearish break below 1972. 185$ support area is going to end up Trend in the daily chart of gold versus US dollar pair
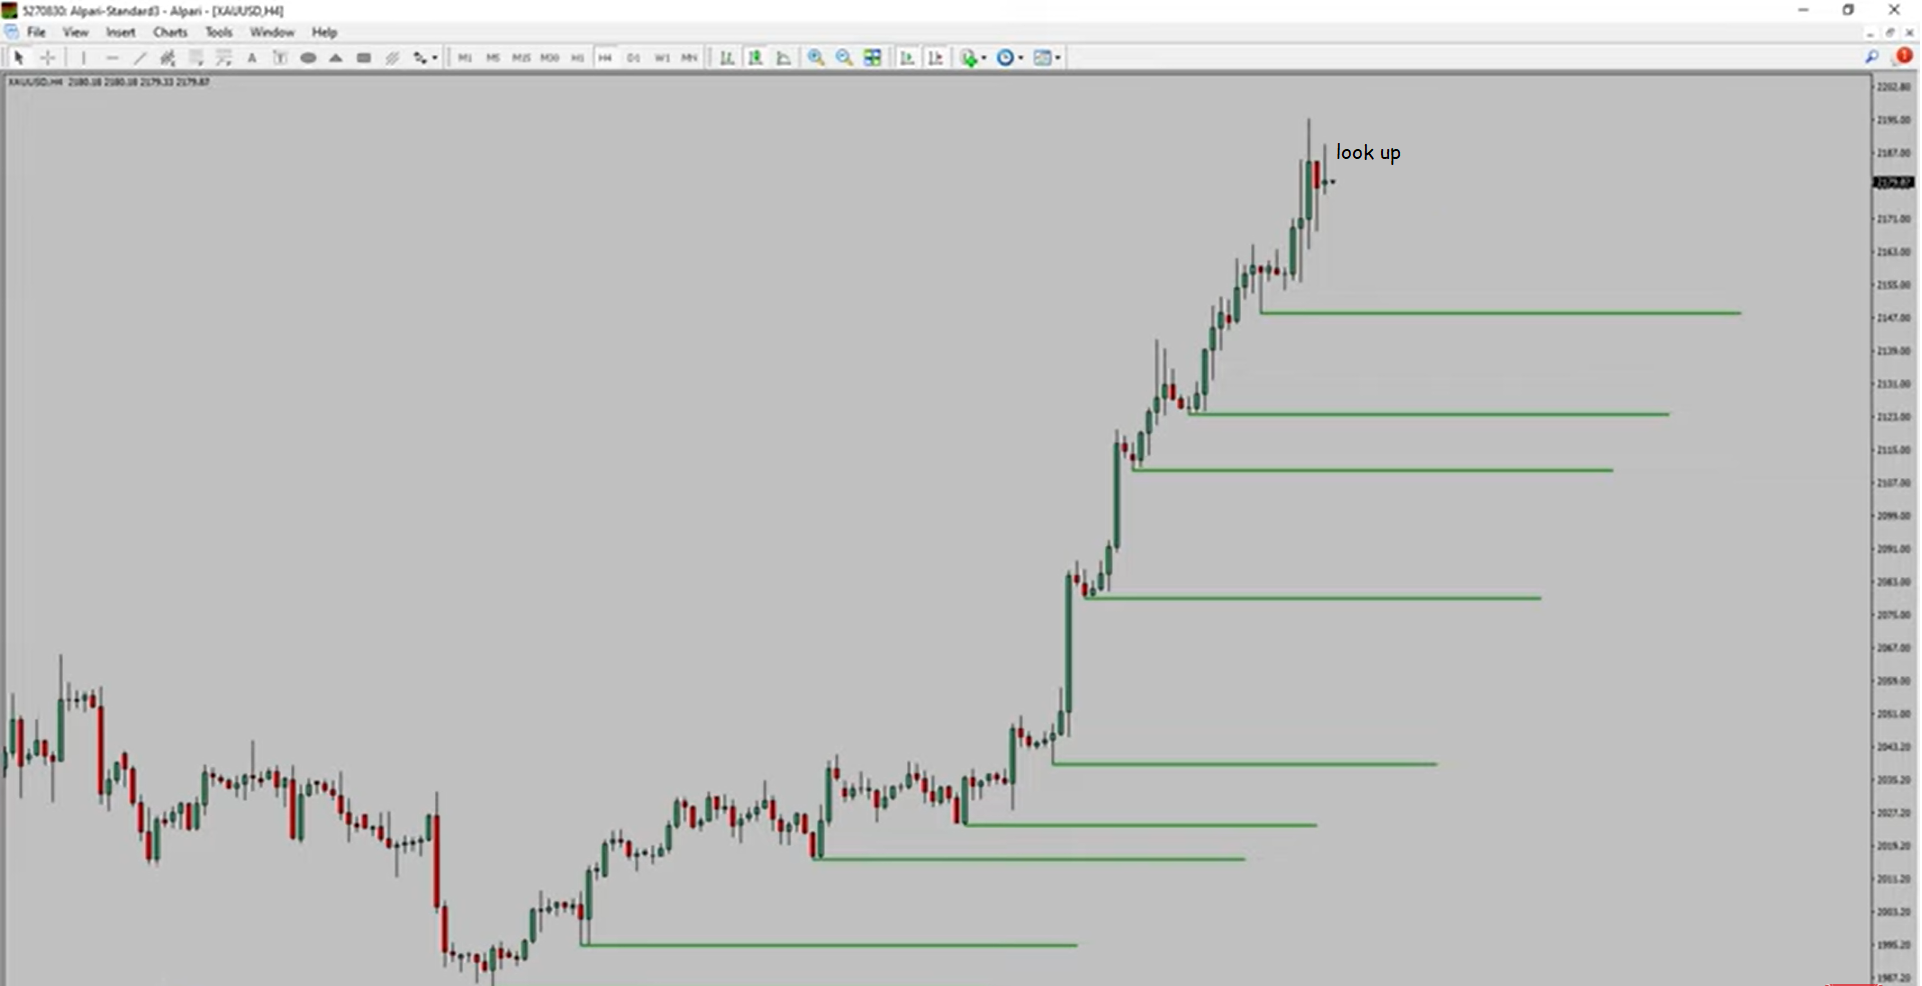
At 4-hour time frame price action is printing higher swing highs and higher swing lows to me spot gold Trend looks up in 4-hour time frame
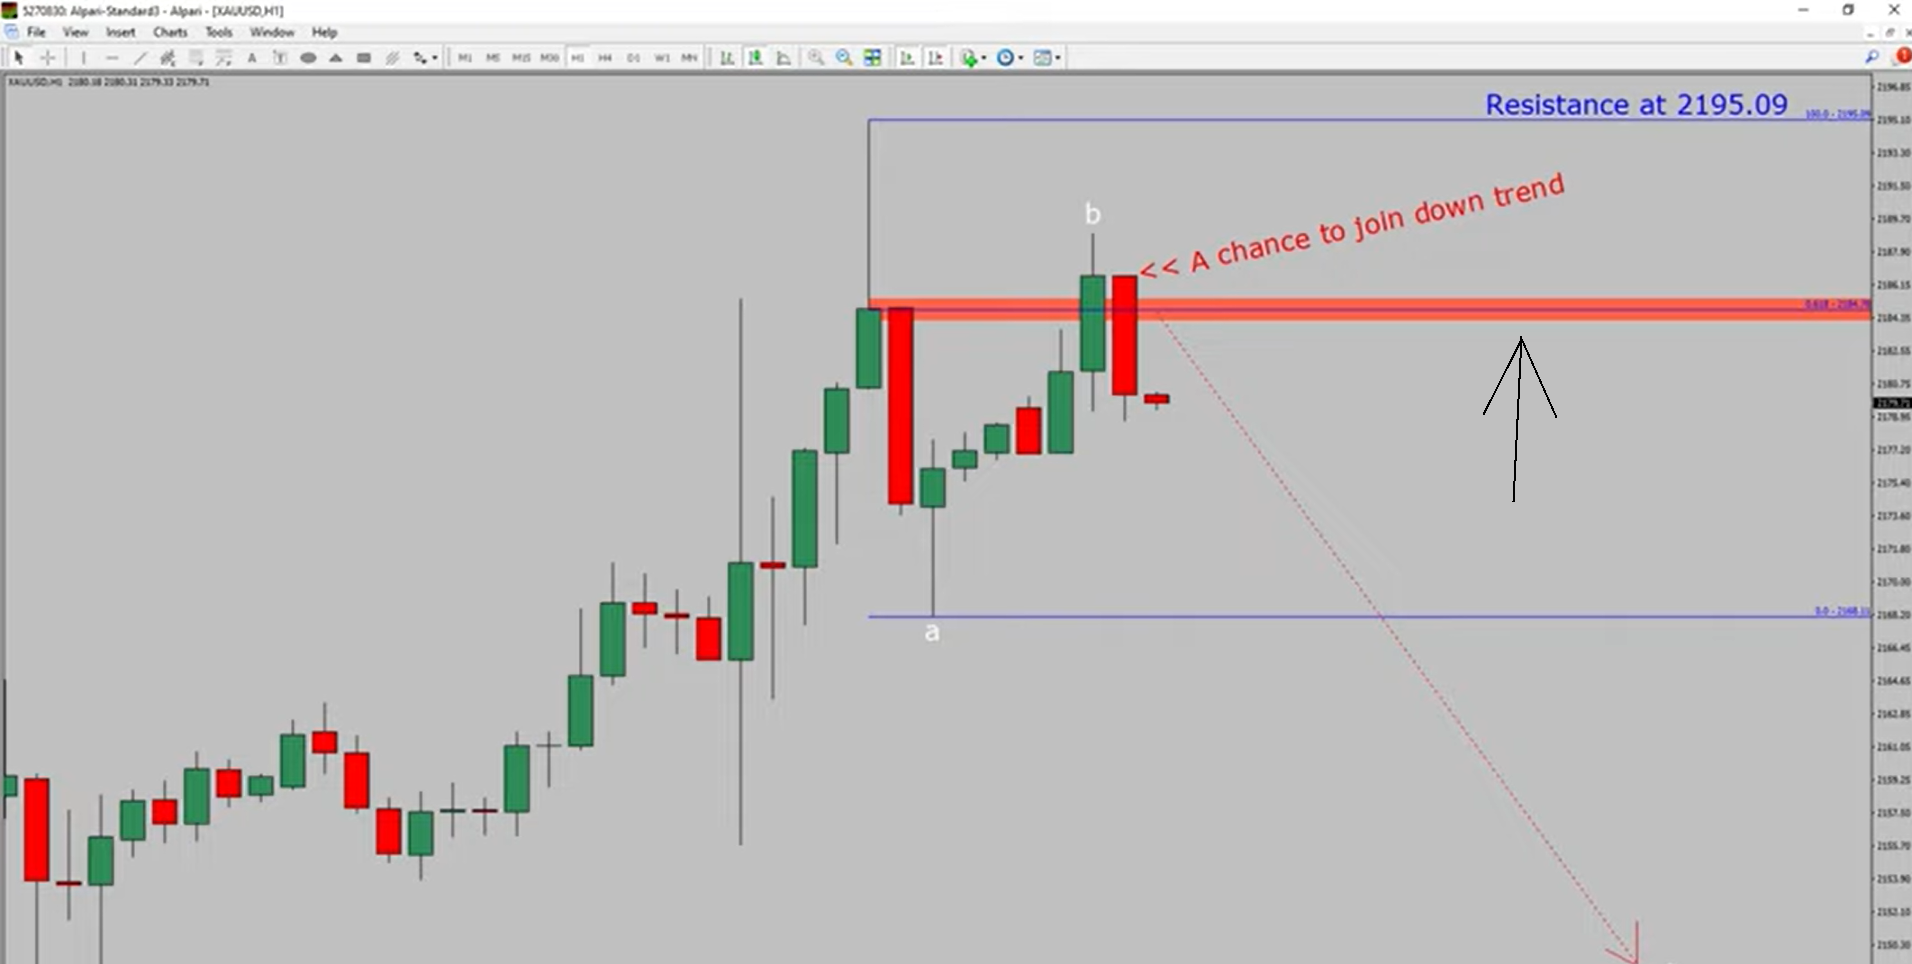
let us take a look at one-hour time frame the trend is down in 1 hour chart intraday resistance is present at 21 95.9 price level price section is the most likely going to drop to print a bearish wave C zigzag corrective leg which offers a CH chance to join the downtrend in spot gold decisive bullish breakout above 21 95.9 resistance level is going to end downtrend
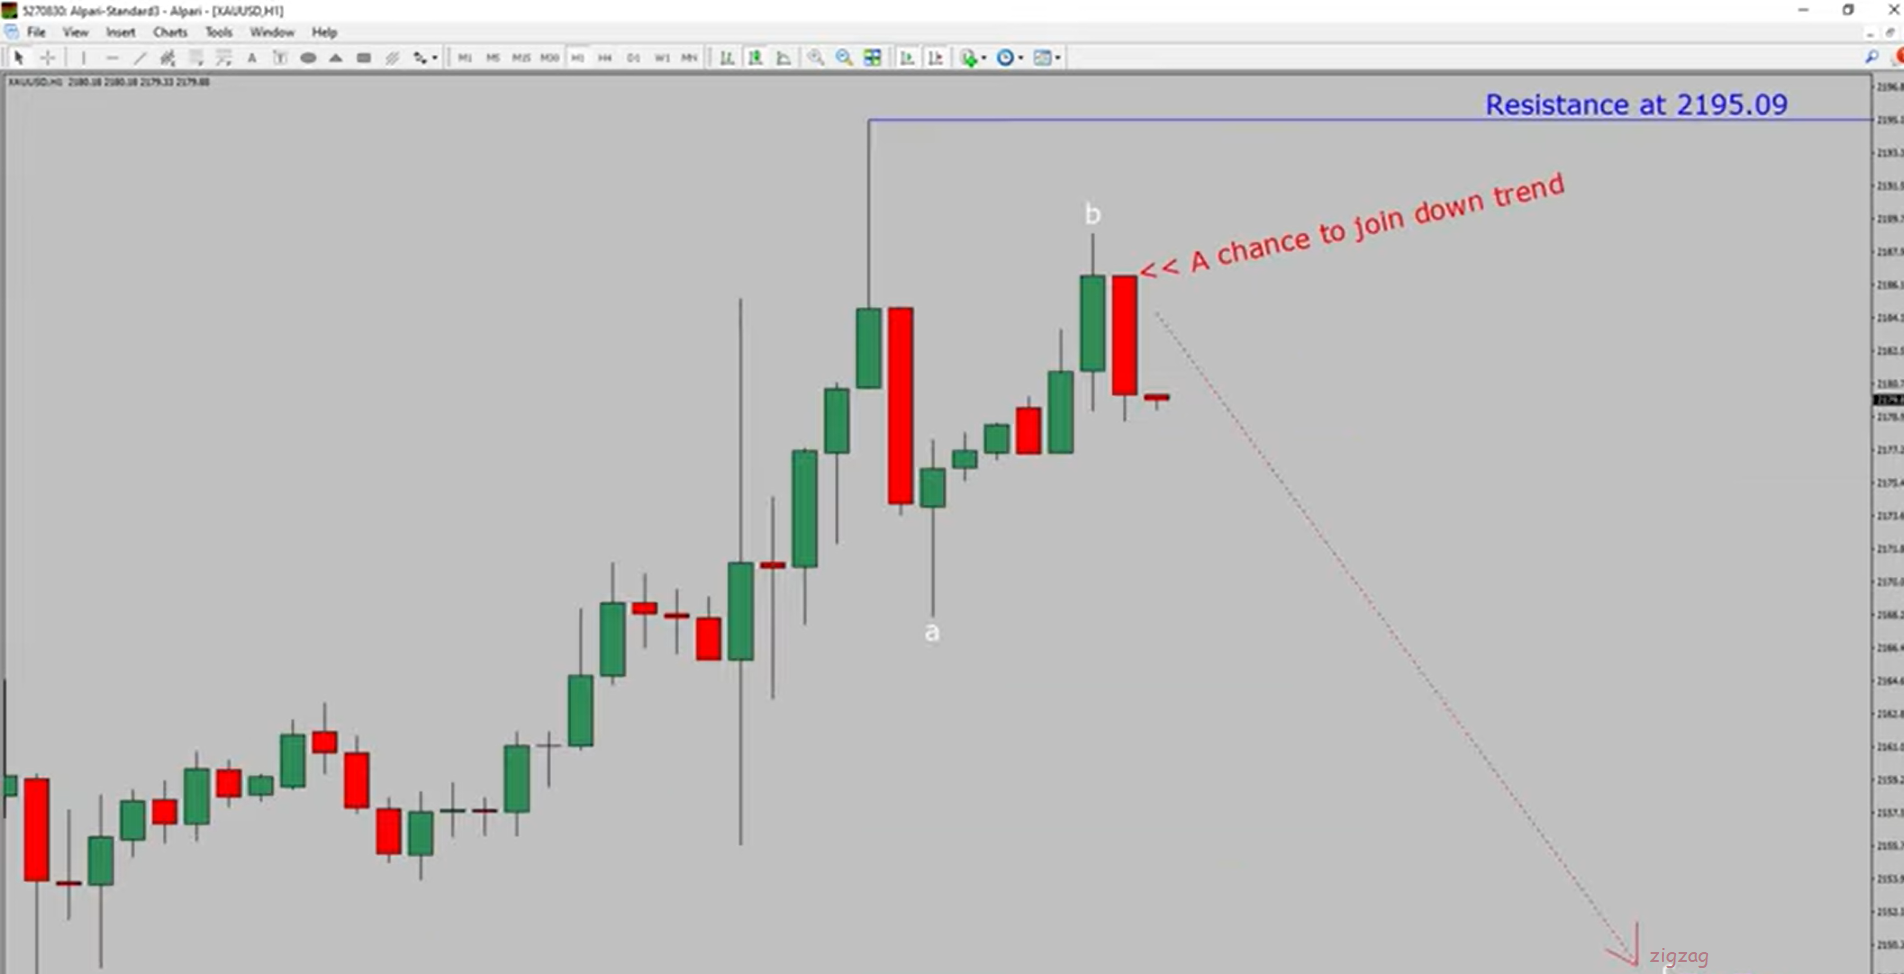
In one-hour chart of gold versus United States dollar currency is preferred to be more specific the red color highlighted area offers the selling opportunity which is the previous second wave one lesser degree take note you must always be straight with money management rules to control risk