In this analysis, we are observing the potential
repetition of market history by comparing
the current Bitcoin price action to the
previous bullrun cycle. By utilizing Fibonacci
retracement levels, historical patterns, and the
current macroeconomic landscape, we can
formulate a hypothesis that the market might
follow a similar trajectory if bearish sentiment
prevails.
Historical Comparison
During the last bullrun, Bitcoin experienced
significant price appreciation before eventually
reaching a new all-time high (ATH). However,
one key observation from the previous cycle is
that before Bitcoin reached its ATH, the price
retraced to the 0.618 Fibonacci retracement
level multiple times. This level acted as a
critical support zone, where the price found
demand before making the next leg upward.
Currently, we are seeing a similar pattern
unfolding. Bitcoin has recently experienced
a parabolic rise, reminiscent of the previous
bull cycle. As the market is showing early
signs of exhaustion, the possibility of a deeper
retracement towards the 0.618 Fibonacci level
(around $50,000) is becoming increasingly
plausible. If history repeats itself, this level
could act as a springboard for the next
significant price increase.
Last bullrun we had a 77% drop, and from the
current ATH its only a 55% drop to the fib level:
Bearish Sentiment and Market Dynamics
Despite positive news emerging globally, such
as the USA announcing its Bitcoin reserves
and other adoption-related headlines, the
market has reacted negatively, which is a
characteristic of bearish sentiment. This kind
of price action aligns with what we saw in
previous cycles, where good news failed to
provide upward momentum as the market was
already in a distribution phase.
The fact that Bitcoin has failed to sustain
gains even amid positive news further
reinforces the likelihood of a deeper
retracement. The market is driven by liquidity
cycles, and the large players may still be in the
process of shaking out retail investors before
the next parabolic move.
Key Fibonacci Levels to Watch
· 0.618 Level (~$51,500): Historically tested in
the last cycle before the final leg up.
0.65 Level (~$48,500): Another confluence
zone that could provide significant support.
0.786 Level(~$36,000-$40,000): If the
market becomes extremely bearish, this
level could act as the final capitulation zone
before the next macro bullrun.
Psychological and Macro Factors
Additionally, the broader macroeconomic
environment plays a crucial role in this
scenario. With ongoing geopolitical tensions,
inflation concerns, and central banks
monetary policies, investors are more
risk-averse, which could further contribute to
the bearish price action.
Historically, Bitcoin has shown strong
correlation to traditional markets, especially
during uncertain times. If the macroeconomic
environment remains unstable, Bitcoin could
follow traditional markets into a corrective
phase before making a recovery.
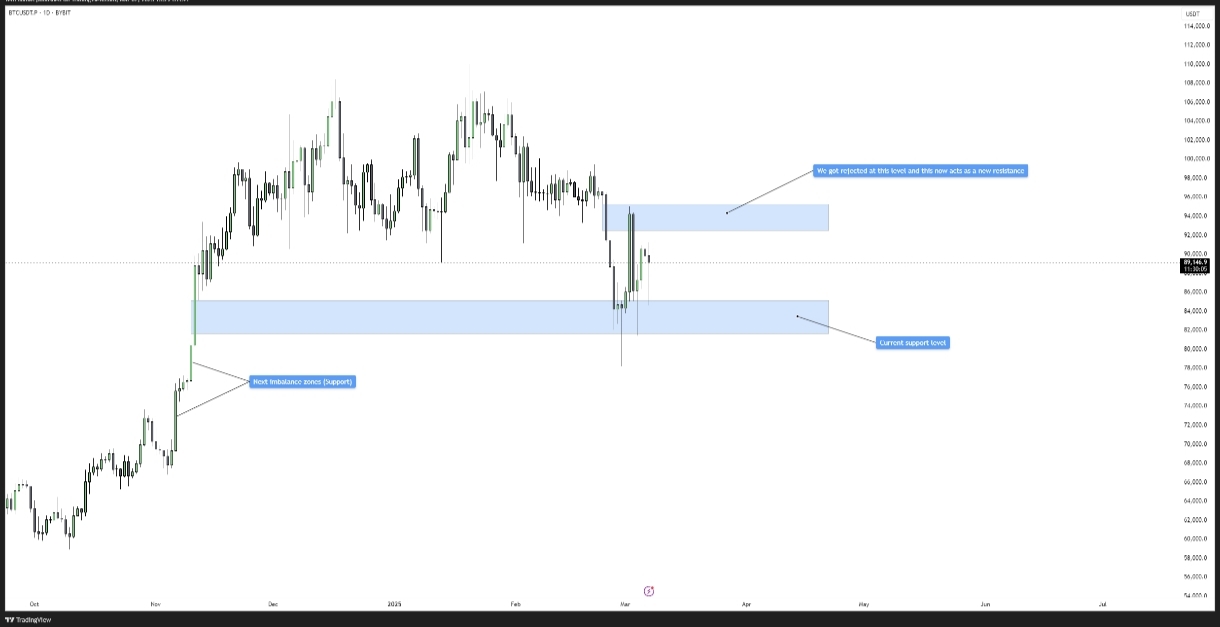
Daily Chart Imbalance Zones
On the daily chart, Bitcoin is currently trading
between two key imbalance zones. These
zones represent areas of liquidity where the
market could either find support or break down
further. The current price action suggests
that if Bitcoin holds the imbalance zones as
support, the market structure will still be intact,
leaving the possibility for a continuation of the
upward trend.
However, if these imbalance zones fail to hold,
it would signal a bearish continuation pattern.
In this case, the probability of Bitcoin testing
the $50,000 level as the next major support
becomes highly likely. Traders should closely
monitor these zones, as they will play a pivotal
role in determining the market's next major
move.
Conclusion
While no analysis can predict the future
with certainty, the confluence of technical,
historical, and macroeconomic factors
suggests that Bitcoin might follow a similar
pattern as the previous bullrun. A retracement
to the 0.618 Fibonacci level around $50,000 is
highly plausible before a new ATH is achieved.
However, if bearish sentiment continues to
dominate, we could see lower levels before the
market finds its true bottom.
The current price action, coupled with negative
market reactions to positive news, is an
indication that larger players might still be
accumulating before the next leg up. Traders
and investors should remain cautious, monitor
key Fibonacci levels, and be prepared for
heightened volatility in the coming months.
Only time will tell if history will indeed repeat
itself, but the current evidence suggests that
the market might be following a familiar path
once again.
Disclaimer
The information and publications are not meant
to be, and do not constitute, financial,
investment, trading, or other types of advice or
recommendations supplied or endorsed by
TradingView. Read more in Terms of Use.
Trend Analysis
Technical Indicators
TehThomas
Fibonacci
bitcoinprediction
PREMIUM
Experienced trader with 6 years of expertise
in financial markets.
Sharing free info to help traders develop
and refine their strategies