Good morning everyone, while observing the current state of the crypto market, my eyes fell on the Tron or TRX chart today. The start of 2026 looks quite interesting for TRX. I have been digging into its price action and technical indicators very deeply for the past few days. I felt that I should share my research and thoughts with you.
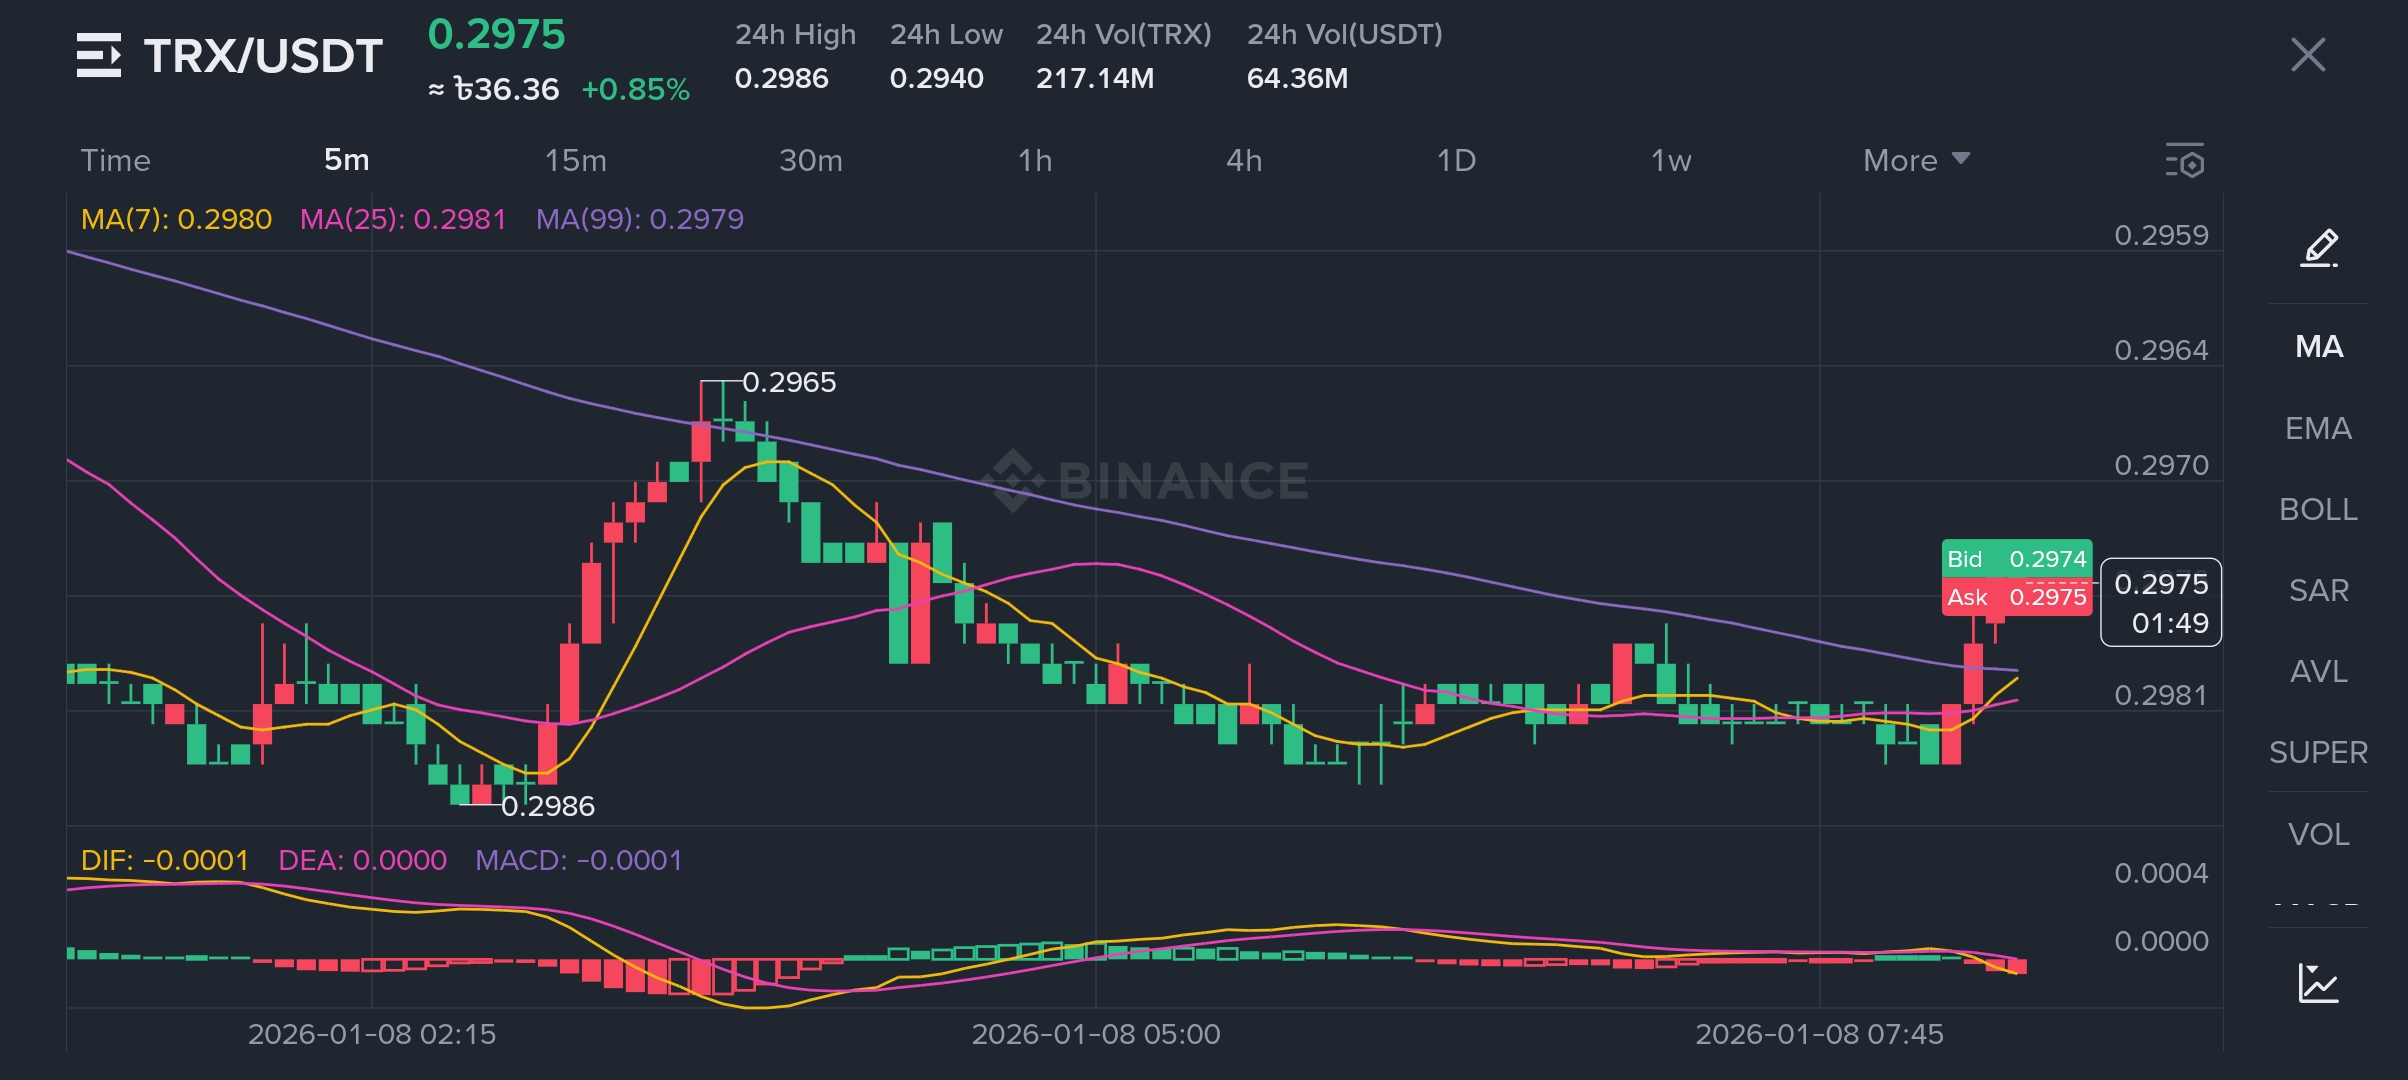
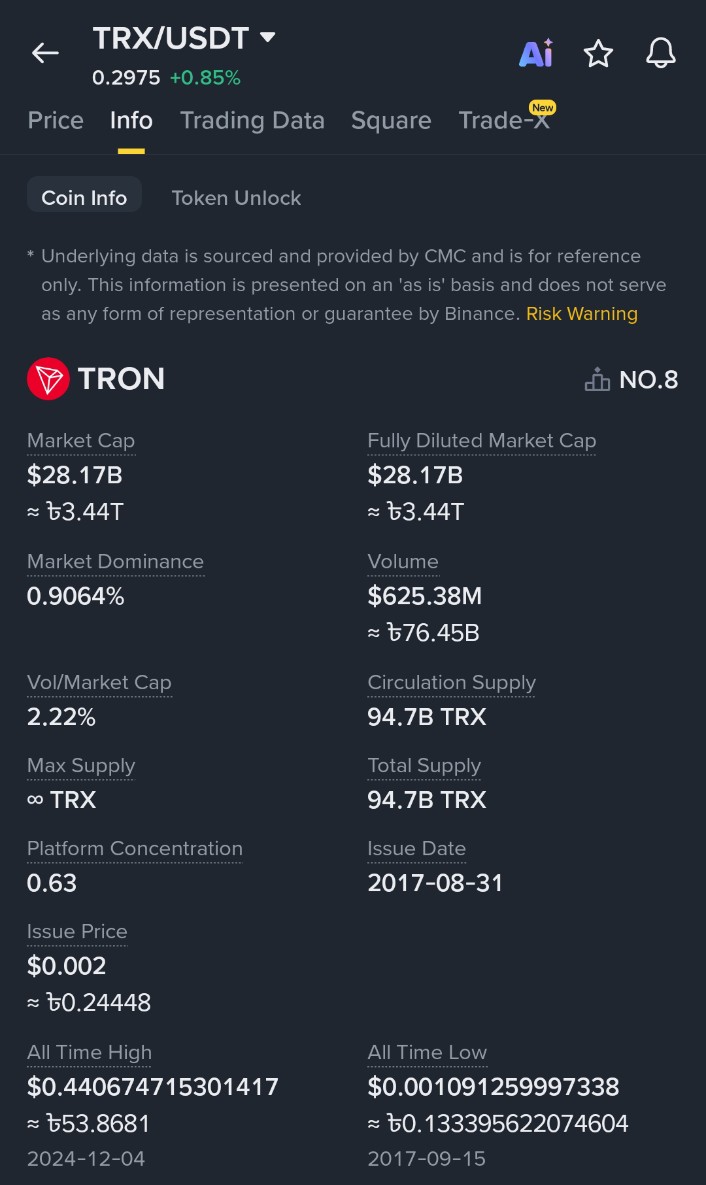
TRX is currently trading around $0.2950. It is now one of the top coins in terms of market cap. But the real question is, will we see any major movement from here? Let’s break down what the chart is saying.
Chart Patterns and My Observations
When I was looking at the daily chart of TRX in Trading View, I noticed a “descending channel. Although it is usually considered short-term bearish in trading terms, experienced traders know that this pattern often indicates a major uptrend. Simply put, the price is currently moving within a channel, but if it can break the upper resistance line, we could see a major pump.
According to my analysis, if the current trend continues and the market sentiment remains positive, we can soon see TRX at the levels of
**0.3510∗∗ and later∗∗ 0.4518. That is, it has a strong chance of surpassing its all-time high (ATH) of $0.4407, which was csetin December 2024. However, the market always needs to be prepared. If, for some reason, the trend reverses or the market goes down, then 0.2002 is a strong support zone. We should keep an eye on these levels.
What do the technical indicators say?
Not only the chart pattern, but also I checked some indicators:
1. RSI (Relative Strength Index): It is currently around 62. This means that the market has not yet gone into an ‘overbought’ or overbought state. That is, there is still enough room or ‘space’ for the price to rise.
2. Moving Average (50 MA): The current price is above the 50-day moving average, which clearly signals a bullish or upward trend.
3. Relationship with BTC and ETH: I am noticing that TRX is quite similar to the movement of Bitcoin and Ethereum. When its big brothers (BTC/ETH) are moving, TRX is also following them.
2026 to 2030: Roadmap for the future
If I think a little longer-term, the picture looks more promising. If everything goes well in 2026, TRX will easily break its old record and reach new heights. According to my projection:
2026: Can go up to $0.45. And if there is a big bull run in the market, the dream of touching the $1 milestone is not unrealistic.
2027 - 2030: If the ecosystem develops and adoption increases, the price of TRX can be seen in the range of $1.4 to $1.5 by 2030.
All in all, 2026 is going to be quite important for Tron (TRX) investors. Technical charts say that a consolidation period is going on now and a major breakout is being prepared.
However, the crypto market is always uncertain. This analysis of mine is based on charts and current data. Those of you who are thinking of investing must do your own research. However, my personal opinion is that TRX's current setup is quite positive, and it is a coin to keep an eye on.
Posted using SteemMobile