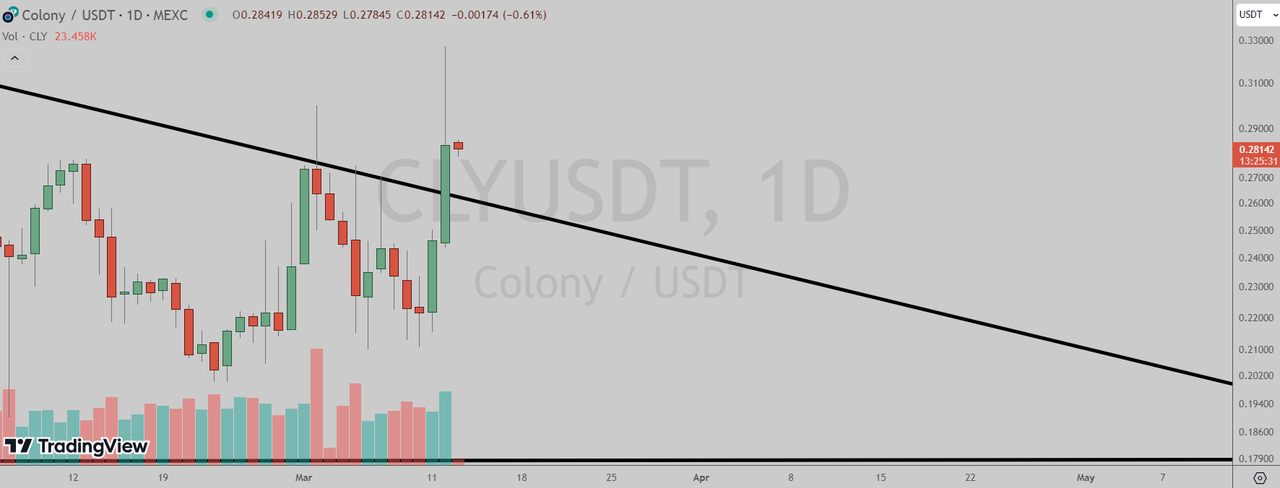
Colony (MEXC: CLYUSDT) has broken out of the triangle pattern in the daily chart.
https://i.postimg.cc/XqYfZ7c1/Nimet-n.png
(Chart courtesy of Tradingview.com(log scale))
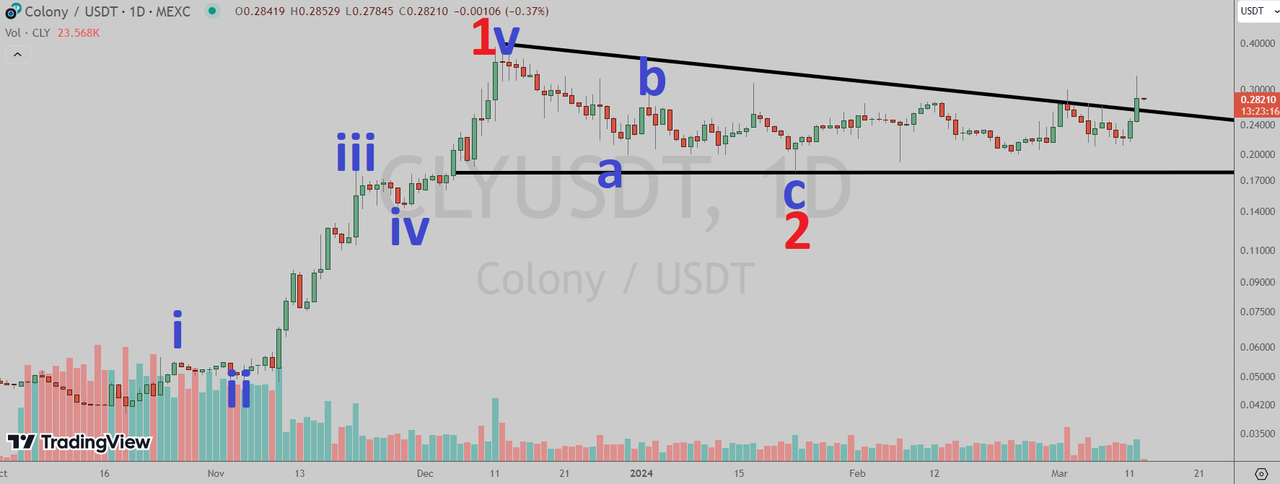
Elliott Wave Analysis
In Elliott Wave terms, CLY began a red wave one advance on October 19, 2023. The red wave one (blue sub-waves i-ii-iii-iv-v) peaked on December 12, 2023 and the red wave two (blue sub-waves a-b-c) correction ended on January 23 this year. If this wave count is correct, CLY should be heading next towards the December 12, 2023 peak in the red wave three.
https://i.postimg.cc/0NFmbp2z/nimet-n2.png
(Chart courtesy of Tradingview.com(log scale))
Funnymentals
Colony is an inclusive platform powering early-stage projects & communities. SwissBorg interviewed the CEO one month ago.
(Sources: https://www.colonylab.io/)
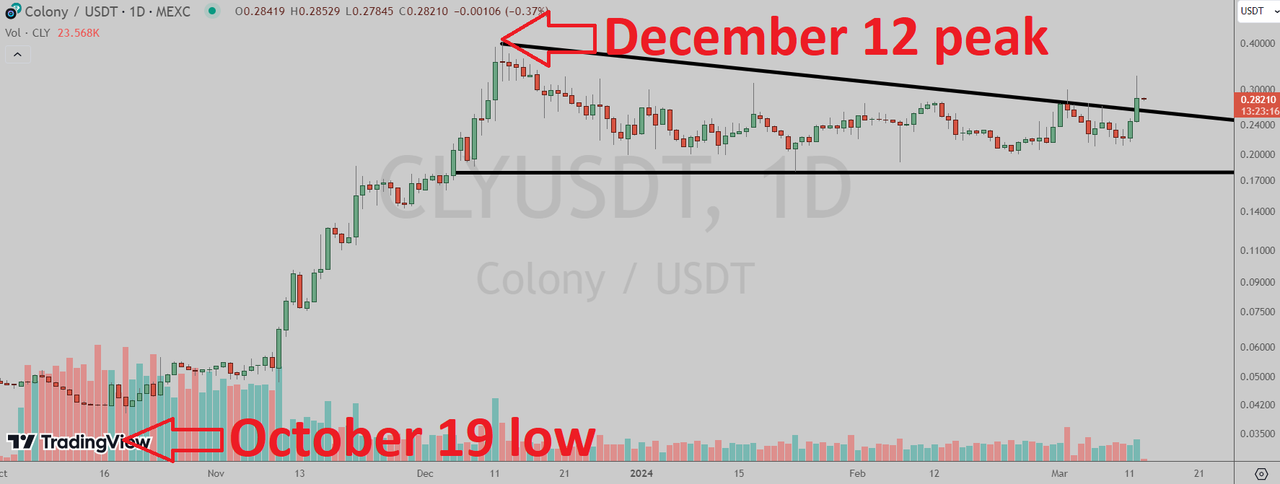
How Will Colony Trade?
Colony (MEXC: CLYUSDT) daily chart by Tradingview.
https://i.postimg.cc/nLprnDwt/nimet-n3.png
(Chart courtesy of Tradingview.com(log scale))
Prizes
I will be giving upvotes to the correct answers (posts only).
Rules
This poll will expire in one week. Only one vote per person.
Which one will happen first?
Please select one of the three choices and comment below
CLY will takeout the December 12 peak
CLY will drop below the October 19 low
CLY will stay in a trading range between the October 19 low and the December 12 peak until April 18