Із сивої давнини до нас прийшли класичні індикатори. Вони виникли за інших обставин, дещо відмінних від нинішніх. Деякі були для акцій й розраховувалися вручну. Інші – для валютних пар. Розвиток технологій привніс автоматизацію та різноманітні зміни в поведінці ринку. Є різні масиви вхідних даних, які можна аналізувати й трактувати під свою потребу й стиль торгівлі. Однак базові індикатори, які пропонують усталено на криптобіржах чи інших торгових терміналах, не дуже то й адаптуються до сучасності. Хоча це переважно на криптобіржах. Чого достатньо для початку, але можна їх використовувати ефективніше.
Власний індикатор буде показувати бажане. До того ж його можна краще адаптувати для торгівлі за допомогою ШІ.
Переважно вони всі мають універсальне використання, на кшталт Ліній Болінджера, Рівнів Фібоначчо чи Ковзних Середніх. І незважаючи на торгову
пару, добре себе показують. Тому STEEM/USDT не виняток. Хоча може мати особливості стосовно унікальних подій, пов'язаних із блокчейном та ончейн-даними. Просто кастомний індикатор може мати більше налаштувань, які дадуть змогу адаптуватися під індивідуальні особливості.
Зараз є багато власних розробок, адже є різноманітні платформи, котрі цьому сприяють. Також ШІ значно полегшує завдання. Особливо, коли знань у програмуванні зовсім немає або дуже маленький мінімум, щоб орієнтуватися в деяких параметрах. Наприклад, є платформа TradingView, де можна робити власні індикатори мовою Pine Script. Також якось було помічено у торговому терміналі Binance можливість додавати власні індикатори у вигляді коду, але як воно діє, треба вивчати детальніше. Тому в мене простіший шлях.
На основі попередніх тем КриптоАкадемії виникла думка, що було б добре зробити візуальне відображення динамічних рівнів підтримки та опору на основі Книги Ордерів. До цього їх доводилося додавати вручну й підписувати. А на маленьких часових періодах вони часто змінюються. На жаль, до TradingView такі дані не постачаються, або ШІ мене обманув, бо перевіряти все – то дуже довга пісня. Тож спочатку легкий варіант.
Загальна суть індикатора:
Його основна мета — візуалізувати цінові області, де відбувалися значні обсягові торги в минулому.
На основі чого він працює (Джерела даних):
close, але налаштовується через i_price_source) close): Використовується для класифікації знайдених рівнів на підтримку та опір.Які дані надає (Візуалізація):
Індикатор малює на графіку:
i_levels_to_show (максимум 3 за замовчуванням) горизонтальних ліній (відображених як кола – plot.style_circles) нижче поточної ціни (за замовчуванням зелені). Вони відповідають цінам свічок з найбільшими обсягами за період огляду.i_levels_to_show (максимум 3 усталено) горизонтальних ліній (кола) вище поточної ціни (за Як робить підрахунок (коротко): Цей індикатор знаходить свічки з найбільшим обсягом за певний період, бере їхні цінові рівні, фільтрує занадто близькі, розділяє на підтримку/опір відносно поточної ціни і відображає до трьох найближчих рівнів кожного типу за допомогою кіл (plot) та текстових міток (label). Він є спрощеною версією першого індикатора, сфокусованою лише на S/R рівнях від обсягу свічок.

Трішки інформативніше, коли до рівнів додається POC та VWAP, але це не зовсім ті дані, які надаються в класичних індикаторах. Тож це
покращена версія попереднього + VWAP та POC Proxy.
На основі чого він працює (Джерела даних):
close, але можна налаштувати через i_price_source).Які дані надає (Візуалізація):
Індикатор відображає на графіку:

По-перше, подібні рівні є, але із врахуванням інших даних чи їх підрахунку та нанесення графічного ландшафту позначок. І вони можуть слугувати під різні цілі. В першу чергу, це зручність, щоб кожного разу не наносити вручну. По-друге, це лише прототип, хоча й ніби показує певний результат на графіку. Адже бажано до цього додати ще й рівні на основі Order Book, тоді буде цікавіше.
Основна генерація сигналів – це короткочасні угоди між рівнями опору та підтримки або на основі їх подолання. Може працювати на будь-якому часовому періоді, але на старших потрібно зменшувати кількість барів (свічок) для розрахунку у налаштуваннях. Бо на краю ціни можуть не відображатися важливі лінії
через недостатню кількість даних. Тож на дрібніших їх треба більше.
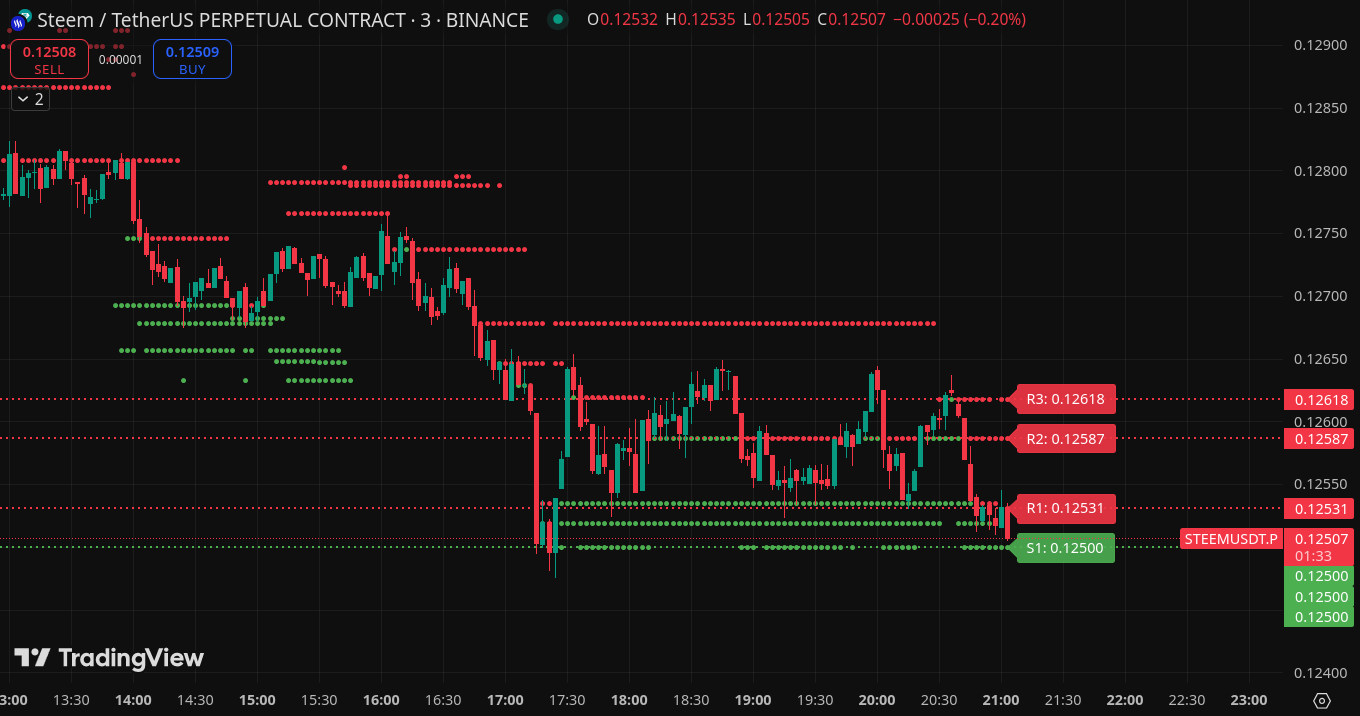
Значить, важливі рівні – це R1-3 та S1-3. Посилення дають POC та VWAP як одночасним їх перетином, так і окремо. Наприклад, на попередньому зображенні демонстрації індикатора є сильні підтримки S1 0.1250 та S2 0.1253, друга має також і POC, від них декілька разів відскакує ціна на 10+ пунктів. А
сильненькі опори R2 та R3 не дають піти вище, тож тимчасовий канал – цікаве місце, щоб зібрати загальною сумою пунктів 20-30 профіту.
Приклад зміни відображення рівнів відповідно до часового періоду та кількості свічок для розрахунку:
+ Свічок 75:
+ m3 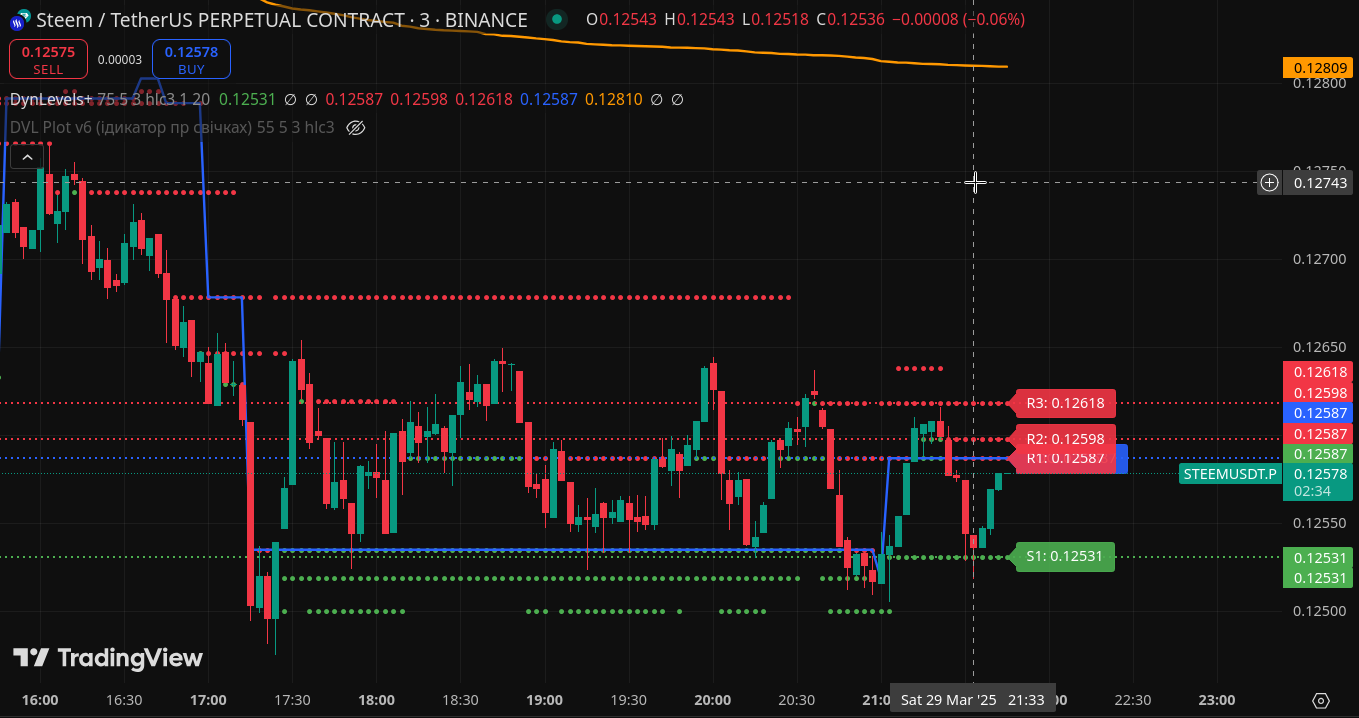
+ H4 
+ D1 
+ Свічок 33:
+ D1 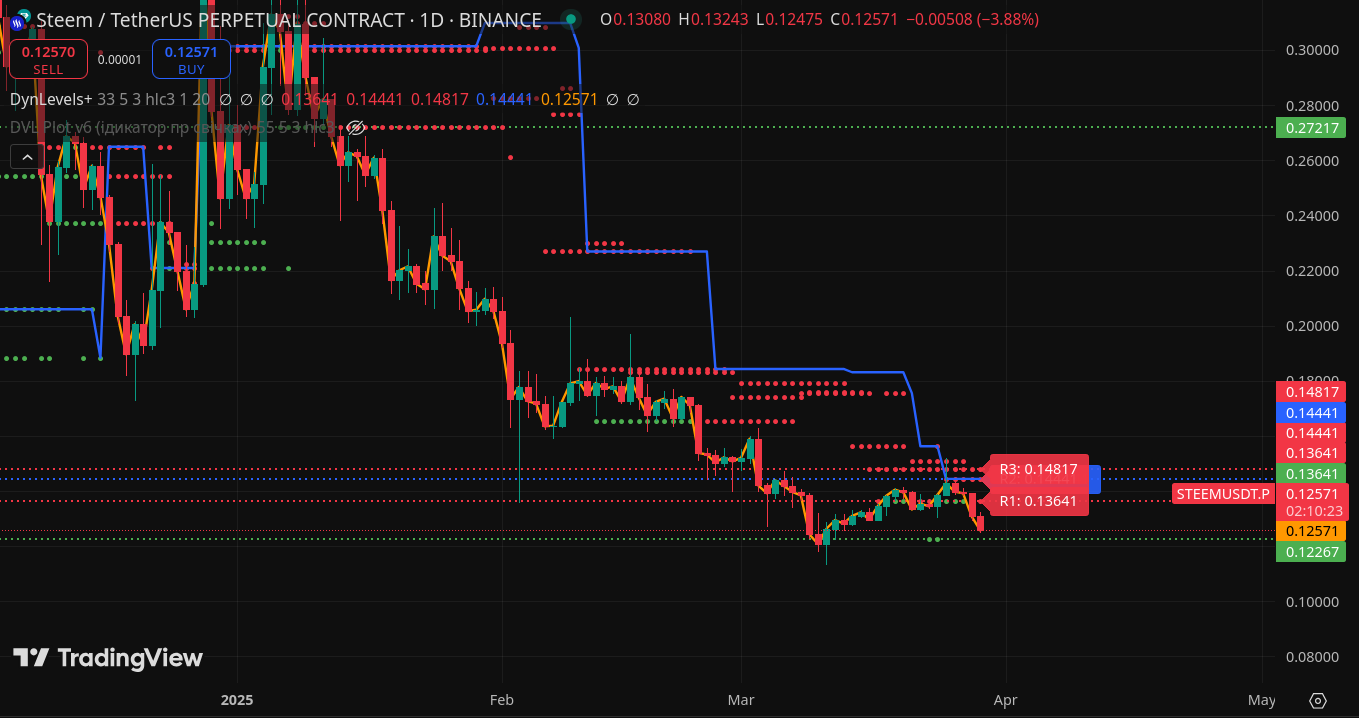
+ H4 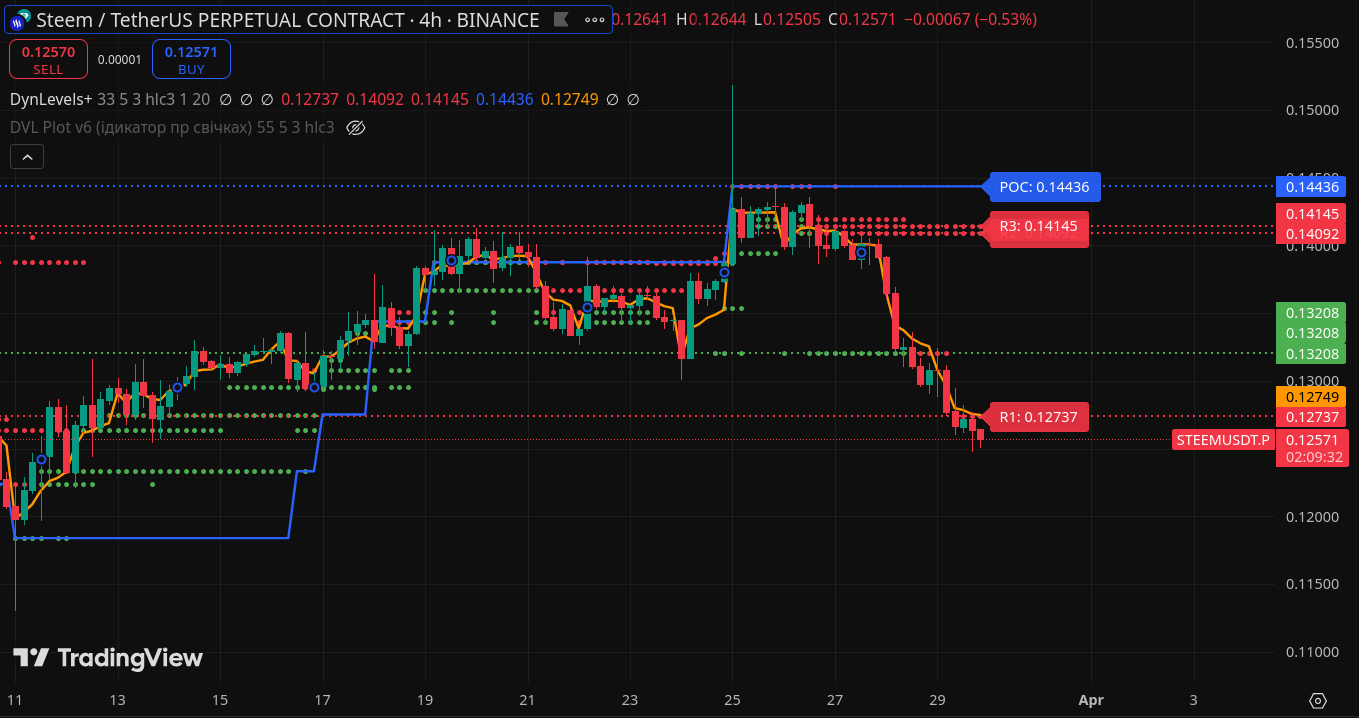
+ m3 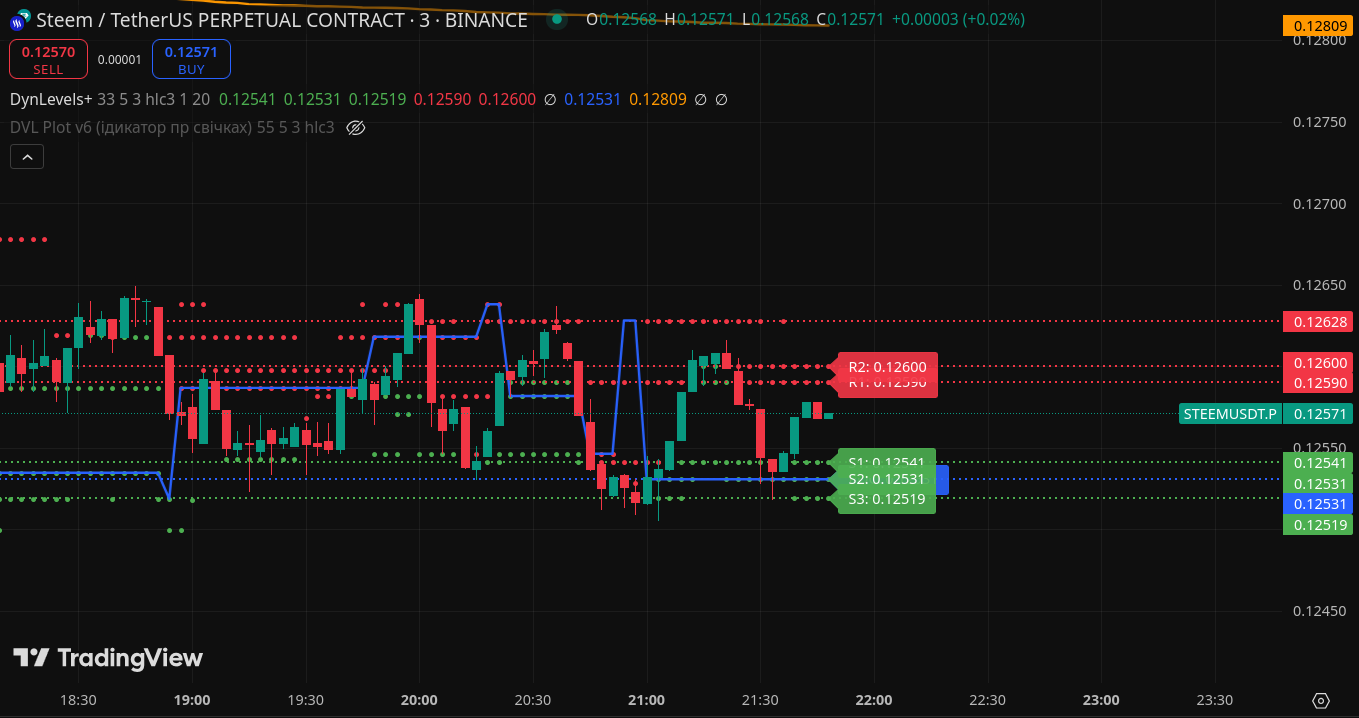
Якщо придивитися, то видно різницю. Тому поведінка індикатора буде залежати від цільових потреб, тобто налаштувань під них.
Переваги (Pros) / Сильні сторони:
Недоліки (Cons) / Обмеження:
i_price_source, напр., ціна закриття) всієї свічки з високим обсягом, а не на точному ціновому рівні всередині свічки, де цей обсяг концентрувався.lookback: Ефективність та релевантність рівнів сильно залежить від обраного періоду огляду (i_lookback). Занадто короткий період може генерувати багато "шуму", занадто довгий – показувати застарілі, вже неактуальні рівні.ta.vwap у Pine Script розраховується кумулятивно від початку завантажених даних на графіку (або від точки прив'язки, якої тут немає). Для класичного інтрадей-використання VWAP часто потрібен його щоденний (або сесійний) math.abs(price_level - existing_level) < syminfo.mintick * 2 для унікальності рівнів може відфільтрувати важливі, хоч і близькі, зони концентрації обсягу.Коли він найбільш ефективний?
lookback (наприклад, 50-150 барів на 5-15 хв графіку) для виявлення актуальних короткострокових рівнів та використання VWAP як динамічної підтримки/опору (з урахуванням обмеження щодо сесійності).lookback (наприклад, 100-250 барів на годинному або денному Так, тут буде гарна історія, як класично по тренду буде вері гуд та хепі-енд.
А що якщо використовувати рівні опору R та підтримки S, та POC із VWAP для підкріплення намірів?
Хронологія за нумерацією, нанесеною на знімок екрана:
1. Отже, 29 березня 2025 року. Ціна на сильній підтримці і трохи підростає;
2. Оскільки є низхідний тренд, а VWAP зверху (помаранчева) і є опір на POC, то є поступове зниження.
3. Закріплення під проміжним опором 0.1273;
4. Подолання підтримки, яка була в точці 1.
5. Нова S.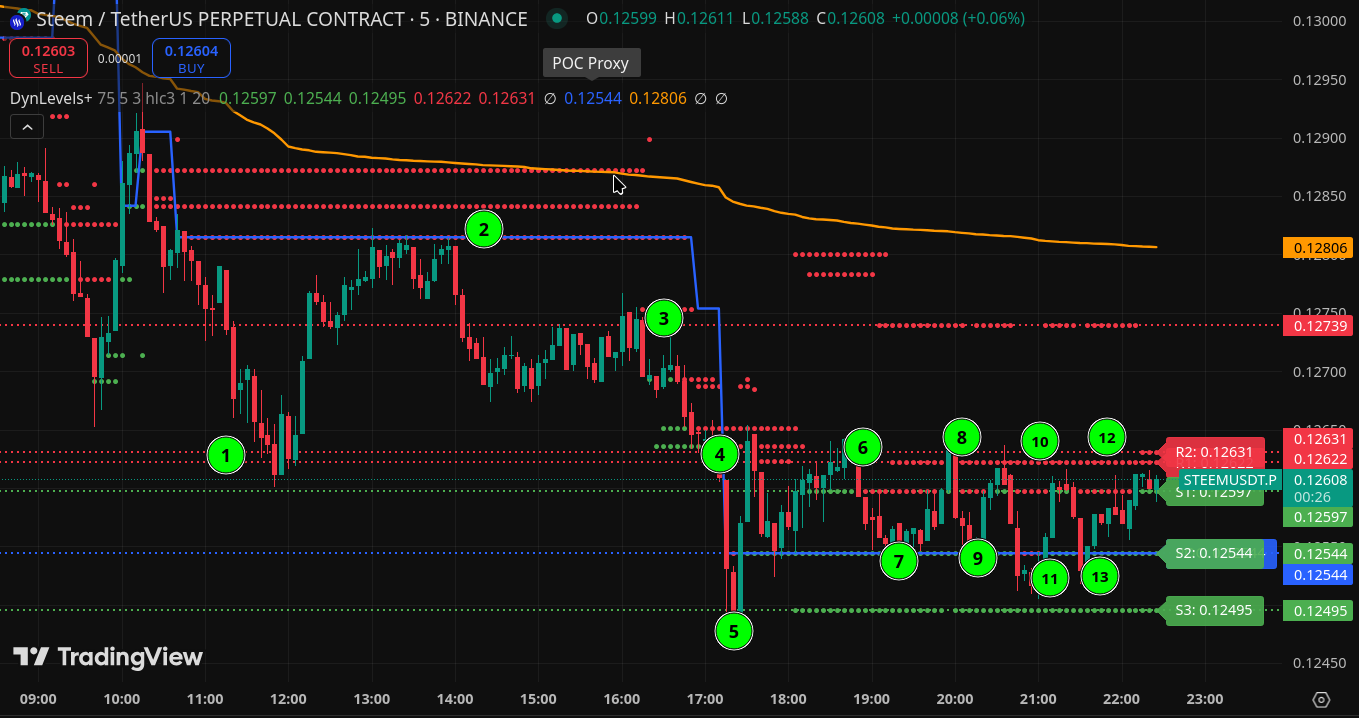
Далі ціла серія рухів у каналі із сильним опором 0.1263 та підтримкою 0.1254, підсвіченою ще як POC.
Тож 6, 8, 10, 12 – потенційні продажі, а 7, 9, 11, 13 – покупки. Тобто потенційно це 13 угод, які із
дотриманням ризиків та вчасною фіксацією доволі добре виглядають. Однак, враховуючи пріоритет
низхідного тренду, можна виділити перевагу точок 2, 3, 6, 8, 10, 12.
В обох випадках лінія POC, хоч вона і не повноцінна відносно цілісного Volume Profile, але теж додає
трішки впевненості.
До того ж STEEM/USDT – не дуже волатильна пара й прослизання має бути мінімальне або відсутнє, що
доволі добре.
Звичайно, малювати щось на історії й розповідати казки, як це добре, – то одна справа, а торгувати
реально на ринку – вже інша. Однак індикатор, в першу чергу, просто допомагає виділити вже сформовані
рівні й підсвітити, де вони можуть бути підсилені в моменті.
Інформація, наведена у дописі, не є рекомендацією для торгівлі й не гарантує прибутку. Все
представлено лише для ознайомлення. Індикатор, хоч і працює, але може потребувати доопрацювання. Тож
його надійність не гарантується, бо можуть бути й збої під час динамічних змін на ринку.
Джерела та використані ресурси:
1. Консультація із ШІ (та й хто ним не користується, хіба що не зізнаються).
2. Платформа TradingView.
3. Знімки екрана із графіком та прикладами індикатора зроблені на TradingView.
| EN translated by AI |
|---|
Classic indicators have come down to us from a bygone era. They originated under different circumstances, somewhat distinct from today's. Some were designed for stocks and calculated manually. Others were for currency pairs. Technological advancements brought automation and various changes in market behavior. There are diverse sets of input data available that can be analyzed and interpreted according to one's needs and trading style. However, the basic indicators offered standardly on crypto exchanges or other trading terminals haven't fully adapted to modern times. This is particularly true for crypto exchanges. While they are sufficient to start with, they could be utilized more effectively.
A custom indicator will display precisely what you want to see. Furthermore, it can be better adapted for AI-assisted trading.
Most standard indicators have universal applications, like Bollinger Bands, Fibonacci Levels, or Moving Averages. And they tend to perform well regardless of the trading pair. Therefore, STEEM/USDT is no exception, although it might possess specific characteristics related to unique blockchain events and on-chain data. Simply put, a custom indicator can offer more settings, allowing for adaptation to individual particularities [of the asset or trading style].
Nowadays, many custom developments exist, thanks to various platforms that facilitate this. AI also significantly simplifies the task, especially when one has little to no programming knowledge, or just the bare minimum required to navigate some parameters. For instance, there's the TradingView platform, where you can create custom indicators using the Pine Script language. I also once noticed in the Binance trading terminal the possibility of adding custom indicators via code, but how exactly it works requires more detailed investigation. Hence, I took a simpler path.
Based on previous CryptoAcademy topics, the idea emerged to create a visual representation of dynamic support and resistance levels derived from the Order Book. Previously, these levels had to be added and labeled manually. And on smaller timeframes, they change frequently. Unfortunately, such Order Book data isn't supplied to TradingView, or perhaps the AI misled me, as verifying everything is a very lengthy process. So, starting with an easier option seemed prudent.

Overall Indicator Concept:
Its main purpose is to visualize price areas where significant trading volume occurred in the past.
Basis of Operation (Data Sources):
close, but configurable via i_price_source) from high-volume candles.close): Used to classify the identified levels as support or resistance.Data Provided (Visualization):
The indicator plots on the chart:
i_levels_to_show (default max 3) horizontal lines (displayed as circles - plot.style_circles) below the current price (default green). They correspond to the prices of candles with the highest volumes within the lookback period.i_levels_to_show (default max 3) horizontal lines (circles) above the current price (default red). They also correspond to the prices of candles with the highest volumes.How Calculation Works (Briefly): This indicator finds candles with the highest volume over a specified period, takes their price levels, filters out levels that are too close together, classifies them as support/resistance relative to the current price, and displays up to three of the nearest levels of each type using circles (plot) and text labels (label). It is a simplified version of the second indicator, focusing solely on S/R levels derived from candle volume.
This version is slightly more informative as it adds POC and VWAP to the levels, although these aren't exactly the same data points provided by their classic counterparts. Thus, it's an enhanced version of the previous indicator, incorporating VWAP and a POC Proxy.
Basis of Operation (Data Sources):
close, configurable via i_price_source).Data Provided (Visualization):
The indicator displays on the chart:

Firstly, similar levels exist, but they might utilize different data, calculation methods, or
graphical representations. They can serve various purposes. Primarily, this indicator offers convenience, eliminating the need to plot levels manually each time. Secondly, this is merely a prototype, although it appears to show some tangible results on the chart. Ideally, adding levels based on the Order Book would make it even more compelling.
The primary signal generation involves short-term trades between support and resistance levels or trading breakouts of these levels. It can function on any timeframe, but on higher timeframes, the number of bars (candles) used for calculation in the settings should typically be reduced. This is because important levels might not be displayed near the current price edge if there's insufficient data within the lookback period. Consequently, more bars are generally needed on smaller timeframes.
The significant levels are R1-3 and S1-3. POC and VWAP provide reinforcement, either through simultaneous crosses of price through them or individually. For example, in the previous demonstration image, there are strong supports at S1 0.1250 and S2 0.1253; the second one also coincides with the POC. The price bounces off these levels several times by 10+ points. Meanwhile, the strong resistances R2 and R3 prevent the price from going higher, making the temporary channel an interesting area to potentially capture 20-30 points of profit in total.
Example of how level display changes based on timeframe and the number of calculation candles:
+ 75:
+ m3 
+ H4 
+ D1 
+ 33 :
+ D1 
+ H4 
+ m3 
If you look closely, the difference is noticeable. Therefore, the indicator's behavior will depend on the specific objectives, meaning the settings chosen to meet them.
Advantages (Pros) / Strengths:
Disadvantages (Cons) / Limitations:
i_price_source, e.g., the closing price) of the entire high-volume candle, not on the exact price level within the candle where the volume was concentrated.i_lookback). Too short a period can generate a lot of "noise," while too long a period might show outdated, irrelevant levels.ta.vwap function in Pine Script calculates cumulatively from the beginning of the loaded chart data (or from an anchor point, which isn't used here). Classic intraday VWAP usage often requires a daily (or session-based) reset to zero, which this script does not perform automatically.math.abs(price_level - existing_level) < syminfo.mintick * 2 for level uniqueness might filter out important, albeit close, zones of volume concentration.When is it Most Effective?
lookback (e.g., 50-150 bars on a 5-15 min chart) to identify relevant short-term levels and use VWAP as dynamic support/resistance (keeping the session reset limitation in mind).lookback (e.g., 100-250 bars on an hourly or daily chart) to identify more significant historical support/resistance zones.Yes, here comes a nice story, like a classic trend-following scenario with a very good and happy ending.
But what if we use the resistance (R) and support (S) levels, along with POC and VWAP, to reinforce our trading intentions? Chronology according to the numbering on the screenshot:
1. So, March 29, 2025. The price is at strong support and slightly rising;
2. Since there's a downtrend, VWAP is above (orange line), and there's resistance at the POC, a gradual decline occurs.
3. Consolidation below the intermediate resistance at 0.1273;
4. Breaking through the support that was at point 1.
5. A new S level forms.
Next, a whole series of movements within a channel with strong resistance at 0.1263 and support at 0.1254, which is also highlighted as POC. Therefore, points 6, 8, 10, 12 are potential sell opportunities, while 7, 9, 11, 13 are potential buy opportunities. This potentially represents 13 trades that, with proper risk management and timely profit-taking, look quite promising. However, considering the priority of the downtrend, points 2, 3, 6, 8, 10, 12 could be favored.
In both scenarios, the POC line, although not a fully-fledged Volume Profile POC, still adds a bit of confidence.
Moreover, STEEM/USDT is not a very volatile pair, so slippage should be minimal or absent, which is quite advantageous.
Of course, drawing on historical charts and telling tales of how well it works is one thing, but trading live in the market is another matter entirely. However, the indicator, primarily, simply helps to highlight already formed levels and indicates where they might be reinforced at a given moment.
Sources and Resources Used:
1. Consultation with AI (and who doesn't use it, they just might not admit it).
2. TradingView Platform.
3. Screenshots of the chart and indicator examples were taken on TradingView.