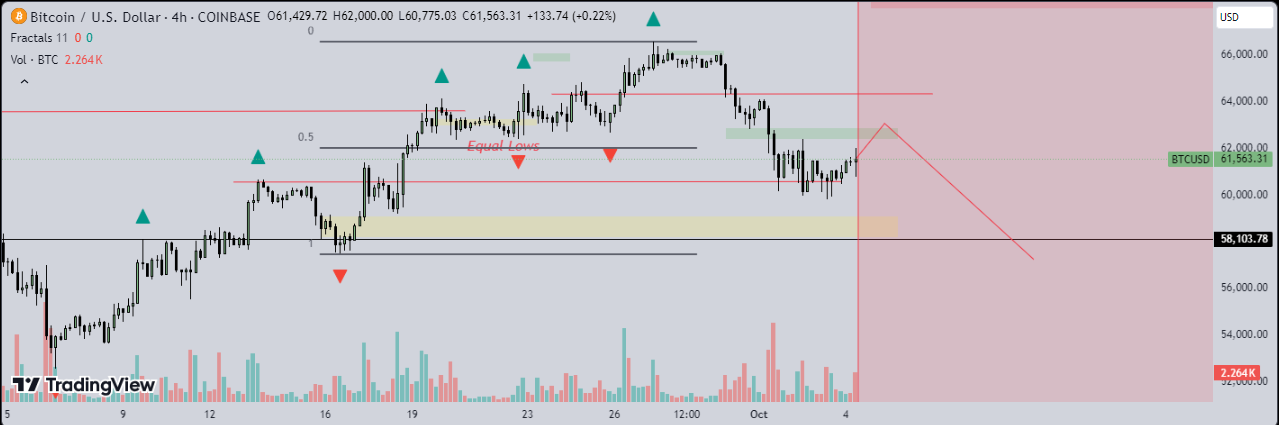
In the chart provided, we observe Bitcoin (BTC) trading against USDT on a 4-hour timeframe. The price is currently hovering around $61,256, showing a minor decline of -0.28% from the previous level. The chart highlights a few important technical factors and potential future price movement.
Key Technical Indicators:
Support and Resistance Zones:
The red horizontal line near $62,000 acts as a significant resistance level. Bitcoin recently tested this area but failed to break higher.
The yellow shaded area between $58,000 - $60,000 represents a crucial support zone. If Bitcoin sees further downside movement, this level is likely where buyers may step in, preventing further declines.
Fibonacci Retracement:
The chart features a 0.5 Fibonacci retracement level (marked on the left), reinforcing that Bitcoin could potentially face a pullback from its current position. A retracement to the $58,103 level (seen as the next major support) is a scenario to consider if the current price level doesn't hold.
Equal Lows:
The chart also indicates equal lows (highlighted in red). This suggests a strong support area, and if Bitcoin breaks below this level, it may trigger a further decline to the lower support range.
Fractals:
Several green and red triangle markers are present, which are fractals indicating local highs and lows. These act as confirmation points where the price could react in the short term.
Volume Profile:
The volume bars show declining trading activity as Bitcoin moves sideways after the recent peak, suggesting weakening bullish momentum. Lower volume during a pullback often signals consolidation before the next significant move.
Potential Scenarios:
Bullish Continuation: If Bitcoin manages to hold above the $60,000 level, there’s a possibility of another attempt to break the $62,000 resistance level. If that resistance is cleared, the next target could be around $64,000.
Bearish Retracement: Should Bitcoin fail to sustain its current price, a drop towards the $58,103 support level may occur, as indicated by the projected downward path in the chart. This would align with a healthy retracement before possibly resuming its bullish trend.
Neutral/Sideways Movement: A prolonged consolidation between $60,000 and $62,000 is also likely, given the current lack of volume and momentum. Traders should keep an eye on the support and resistance levels as price consolidates.
Conclusion:
The Bitcoin market is currently at a crossroads, with potential for both upside and downside movement depending on how it reacts to the $62,000 resistance. Traders should pay close attention to the volume and fractal indicators for clues on the next big move. A break below $60,000 could lead to a retest of $58,103, while holding above this level opens the door to further gains. Patience and careful risk management are key in the current market conditions.