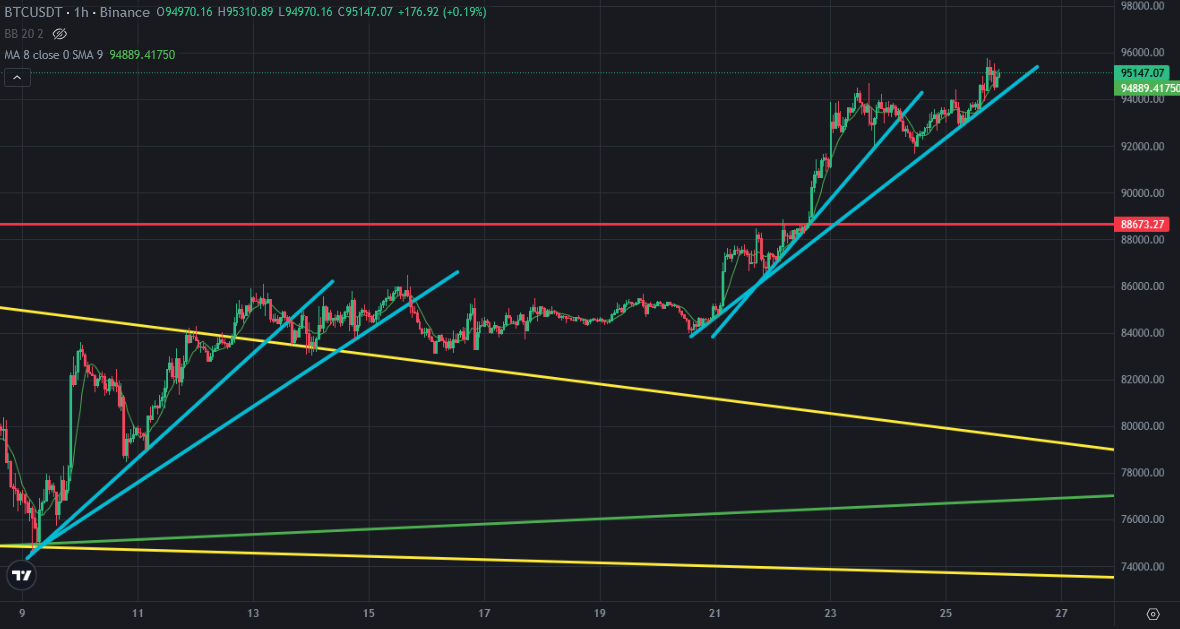
Bitcoin price is in same bullish trend from 76K. It is close to second bullish uptrend line. After breaking down vertical bullish uptrend line, Bitcoin price supported by second bullish uptrend line.
Here you can see hourly chart of Bitcoin. Bitcoin price is close to break down the second uptrend line. We may see Bitcoin price stable after breaking down this uptrend line as before.
It is tested 3 times before as last bullish move.
Here you can see the indicators on daily chart of Bitcoin. If Bitcoin price breaks down second uptrend line on hourly chart, we may see reversing down on Fisher Indicator in daily chart.
There are resistances on MACD and RSI Indicators. They may resist the indicators and Bitcoin price may reverse down in daily chart.
We should see a few red daily candles for this scenario.
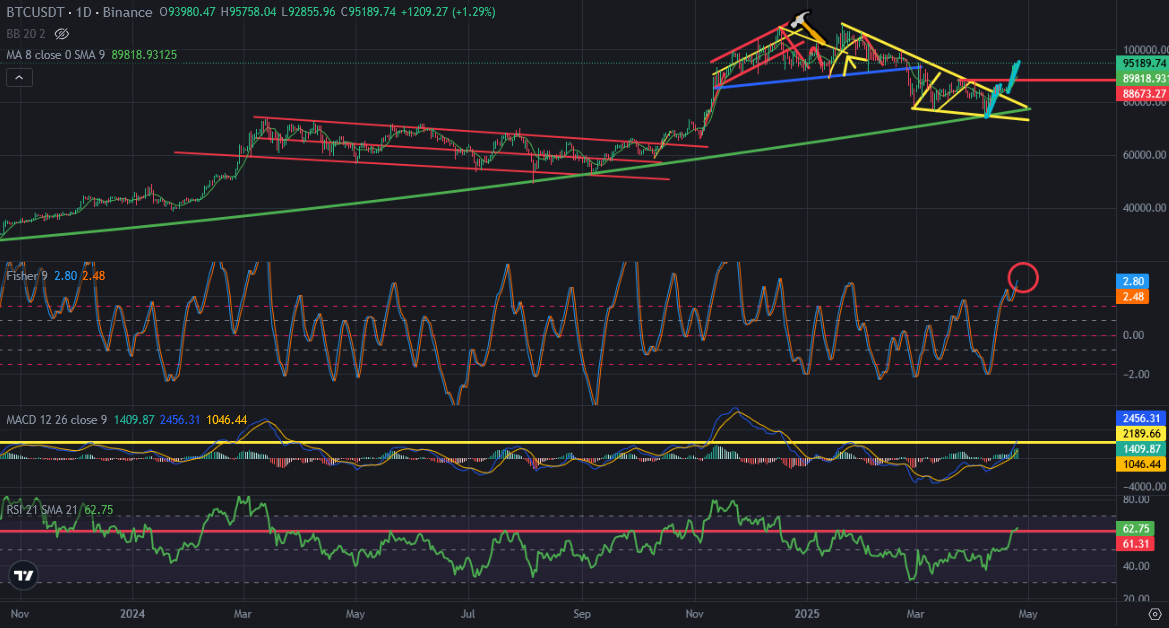
So, we should be careful. There is negative scenario on the table. If we see a few red daily candles, We may see price reversing from 95K and It will be the new resistance level for Bitcoin price chart.
RSI and MACD Indicators resistances are important.
We will see...