Bitcoin is in consolidation zone since March 2024. After going up for weeks and months, Bitcoin price entered consolidation zone for price coorection. It helped for correction for Indicators of Bitcoin.
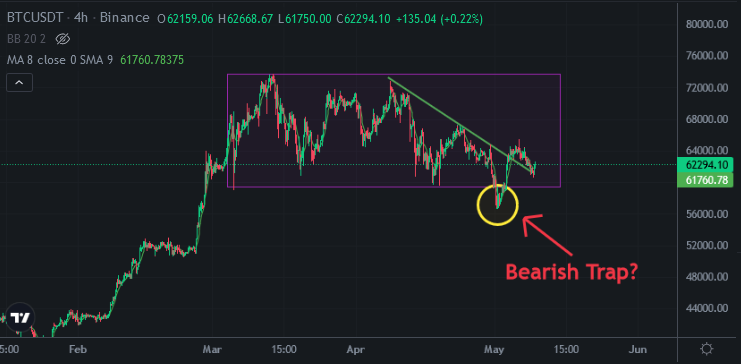
Here you can see 4-hour chart of Bitcoin. There is downtrend line broken uo a few days ago. It may be retest the resistance. Bitcoin price touched again this resistance to be supported. We will follow next price move of Bitcoin. It may be a retest..
There is consolidation channel appeared on Bitcoin price chart. It may be a bearish trap that Bitcoin price touched 57K. The middle level of this channel is at 66K. We may be breaking up this level If Bitcoin wants to go up and make new all time high…
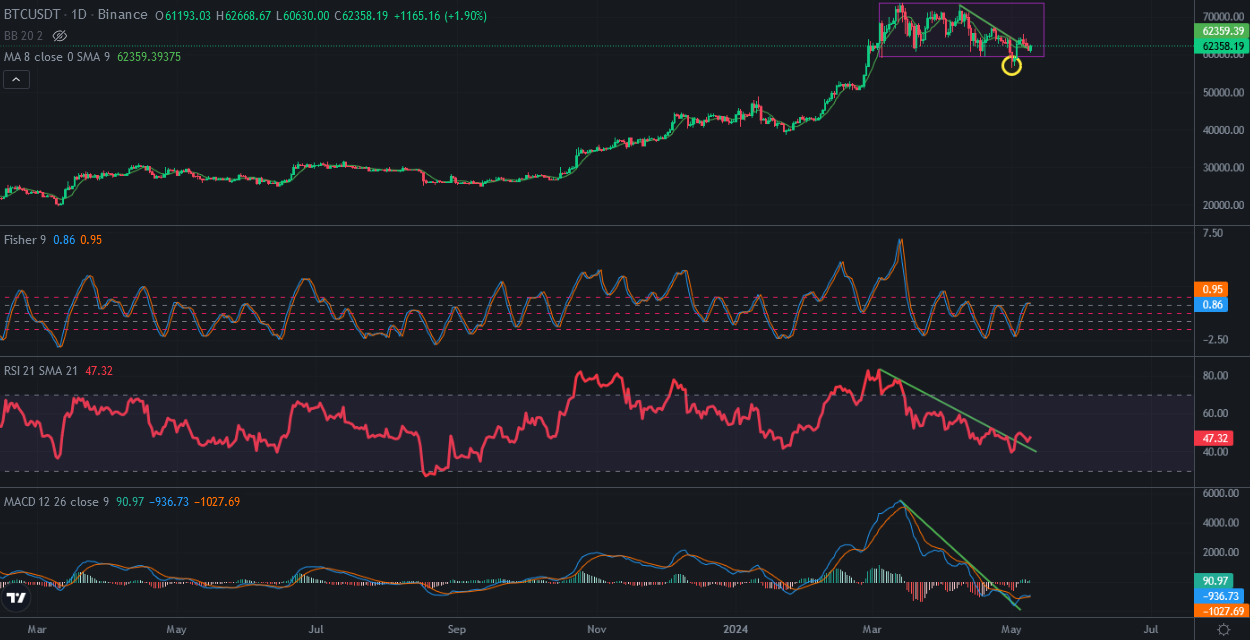
Here you can see daily chart of Bitcoin. Bitcoin broke up the resistances on Indicator. Bitcoin broke up the resistance on RSI Indicator a few days ago. It means Bitcoin might be entered the bullish pattern.
Bitcoin also broke up the downtrend line on MACD Indicator. The only thing Bitcoin needs to go up 0 level on MACD Indicator.
This is bullish scenario for Bitcoin price chart. Monthly chart is not looking bullish but It seems very bullish in short term.
We will see what will be happened in a few days.