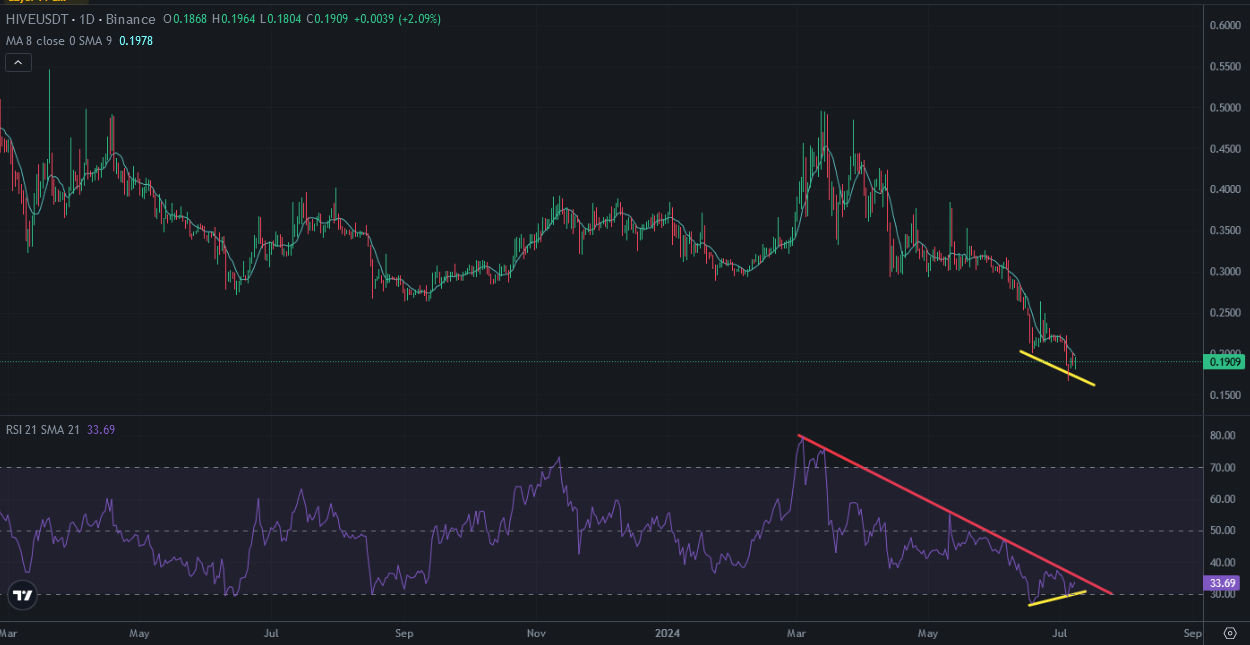
There is positive divergence on Hive price chart. It is one of the signal of being on the bottom. It is major signal of reversing from the bottom.
Here you can see daily chart of Hive and RSI Indicator, Even the bottom of RSI Indicator is decreasing, The bottom of Price is increasing. This is a signal for price up. We may see Hive price going up after these divergence.
There is also great downtrend line on RSI Indicator. This show us when Hive price broke up the resistance and enter bullish trend. RSI Indicator stucked into support and resistance lines and we will see breaking up or down end of this month.
I shared lots of analysis for Hive price chart and said It may be great level to pick up Hive below 20 cents. Here you can see weekly chart of Hive. Fisher Indicator is at the lowest level. It will reverse in a few weeks. It means Hive price will go up in a few week. Positive divergence supported by Fisher Indicator and These are the proof of being on the bottom.
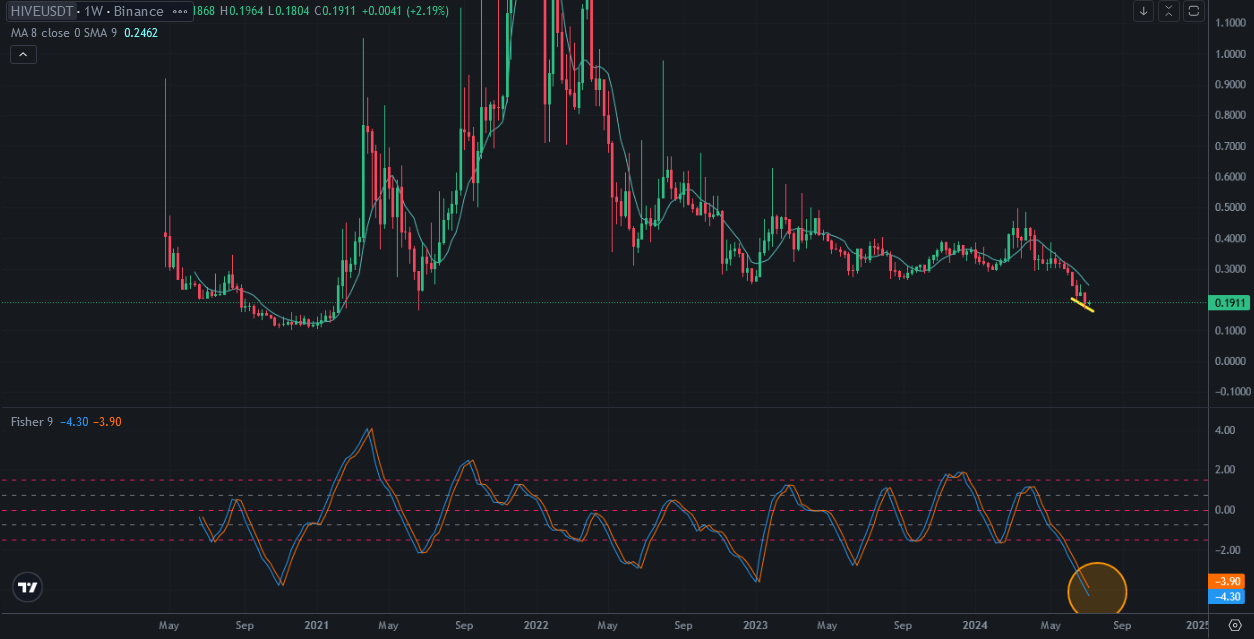
When lots of crypto investors are in fear, It nay be great time to pick up discounted crypto as Hive.
These are the preparation for altcoin season.
We will see.