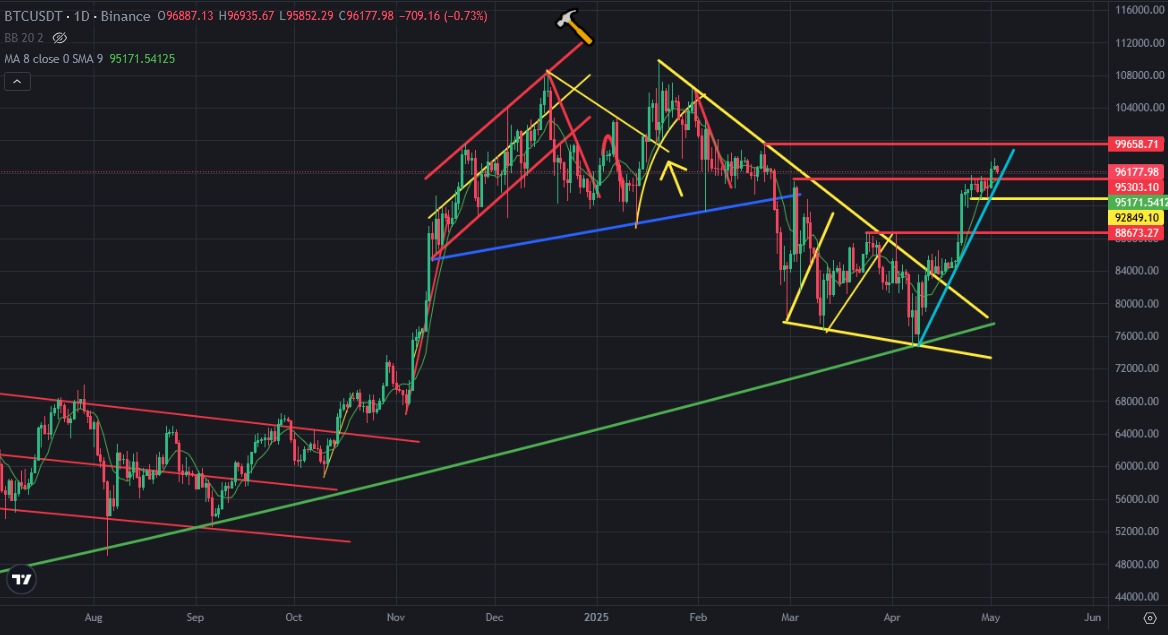
There is mini uptrend line on Bitcoin price chart coming from 76K. Bitcoin price is close to this mini uttrend line. It is going up by supporting this uptrend line. There are the resistances on Bitcoin price chart. 99K USD is the next resistance on Bitcoin price chart and It will be crossed by mini uptrend line.
Here you can see daily chart of Bitcoin. Even it did not touch the next resistance, Bitcoin price is resting on 96K USD level. If we see more red daily candles on daily Bitcoin price chart, Bitcoin price may break down mini uptrend line. If it breakd down, we will see the new mini bearish trend on Bitcoin price chart and Sell in May Go away may start..
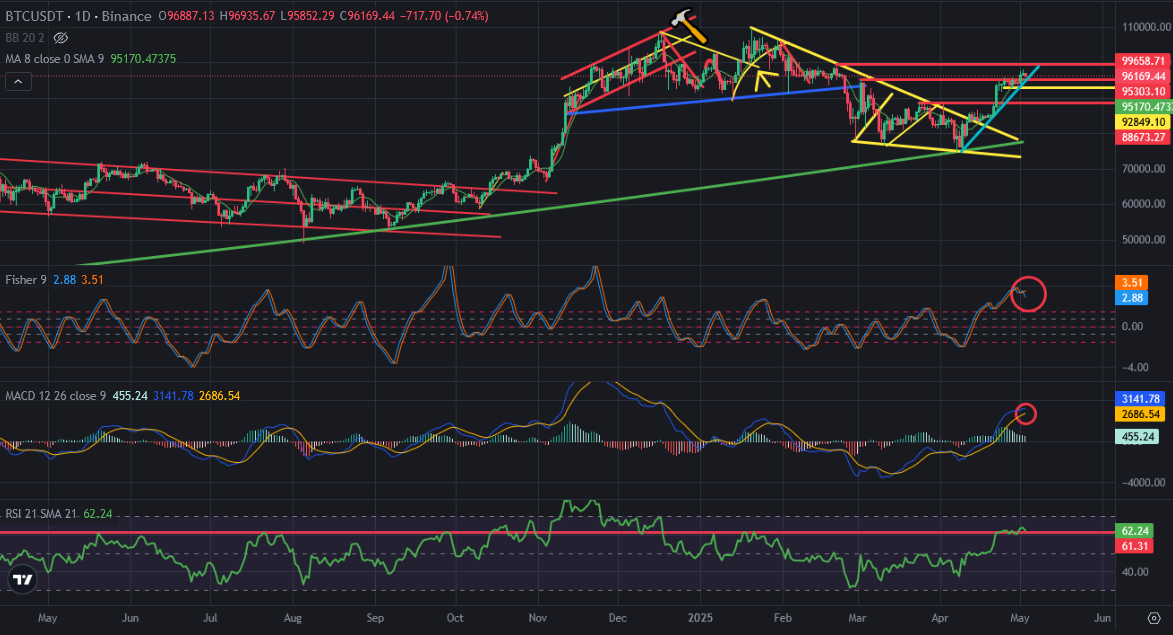
Here you can see the indicators on daily chart of Bitcoin. Fisher Indicator reversed from the top. MACD Indicator is close to reverse down from the top. When we see reversing down on MACD Indicator, It may take long time to reverse up. So, we may entre mini bearish trend on May and It may take a few weeks.
Even RSI Indicator seems as breaking up great resistance, It may be a bullish trap.
So, next week is important. I am waiting for price correction on stock market in next week. We may see volatiliy days in next week.
We will see..