We are at the beginning to see red monthly candles series on Bitcoin price chart. ı shared ana analysis last month when Bitcoin price at 72K and said we are at 9/10 green candles in last 10 months. We had never seen these green candles on Bitcoin price chart and It may be one of the signal of reversing the trend and We are at 2nd red monthly candles series and ıt may be only the beginning. Price correction may take long time.
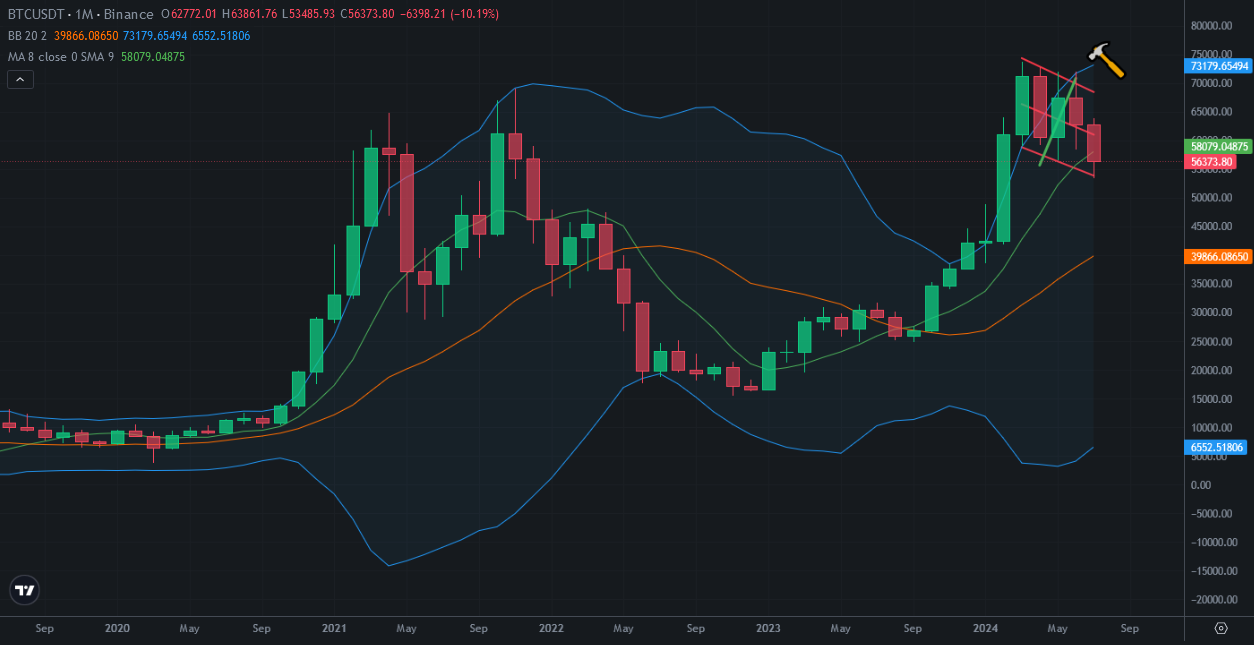
Here you can see monthly chart of Bitcoin price. Bitcoin price is at below 8-months moving average yet. If it closes below 8-month mobing average, It may take long time to go up this moving average..
The middle line of Bollinger Bands is the major support line for Bitcoin price chart. It is so possible to see Bitcoin price touching this support line.
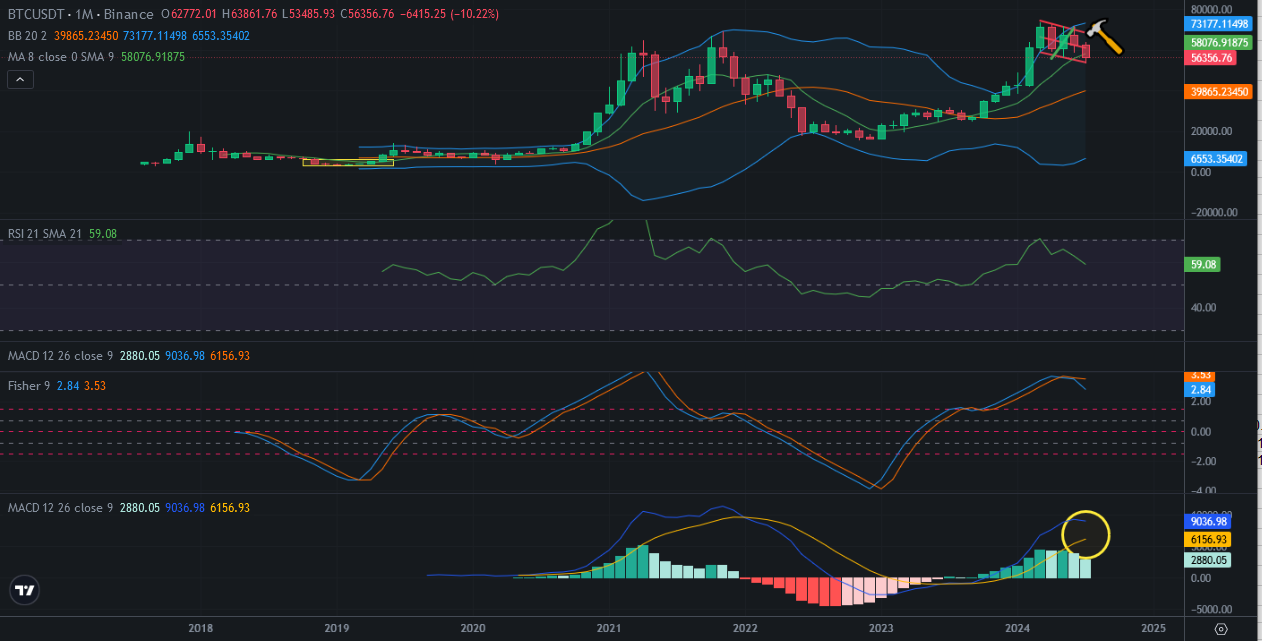
Here you can see the indicators on Bitcoin price chart. MACD Indicator is trying to reverse from the top. If it reverses, bearish season may take so long time. We will waint until 2025 to see relief.
Fisher Indicator is on the top and reversed. It may take long time for correction. RSI Indicator is also at high level. It may not be the beginning og bullish season. It may be the beginning of price correction. So it is the beginning of bearish season.
I shared lots of analysis and said that I would be out of market in April. I am waiting with my cash and picking up slowly altcoins. I will increase in August.
We will see..