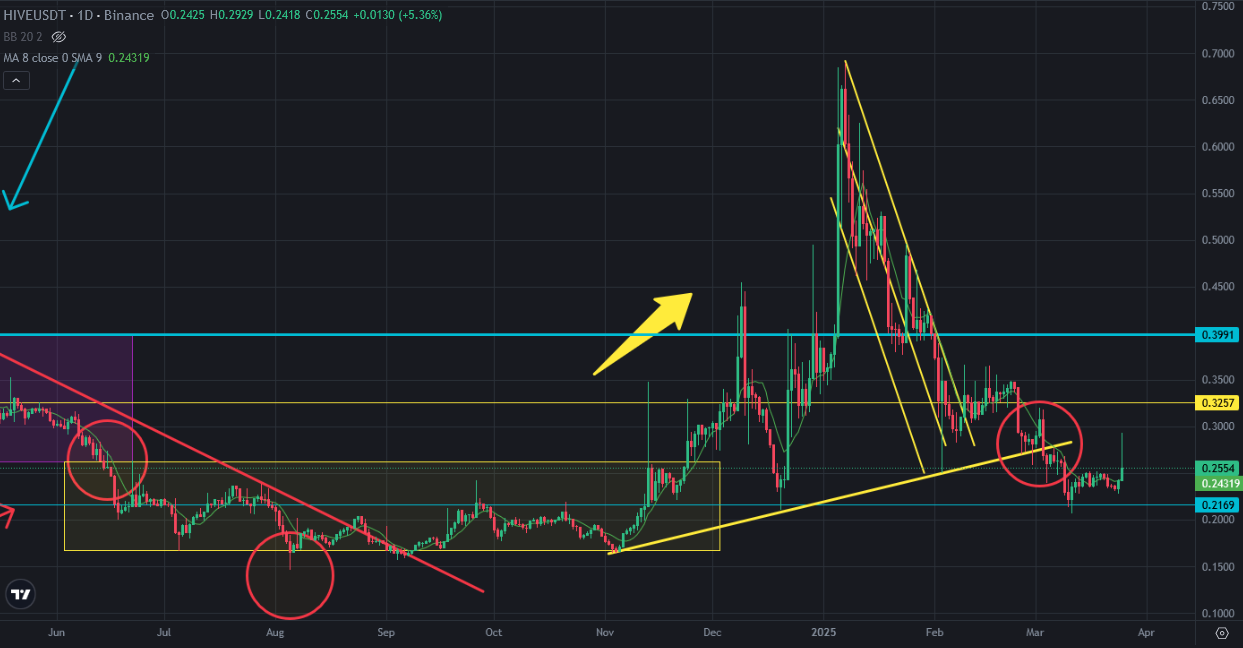
Today Hive price started the day with bullish moves. It is great signal of starting bullish trend.
Here you can see daily chart of Hive price. We have seen lots of huge green candles while Hive price is in bullish trend. The day starts with huge green candle and It goes down during the day. No problem to see the price going down. Because Hive price will go up slowly day by day. We will see huge solid green candles at the end of trend.
We are only at the beginning of bullish move. I shared lots of analysis about crypto market and said I was waiting bullish trend until the end of March or the beginning of April. It started yet. We will see huge bullish moves in April..
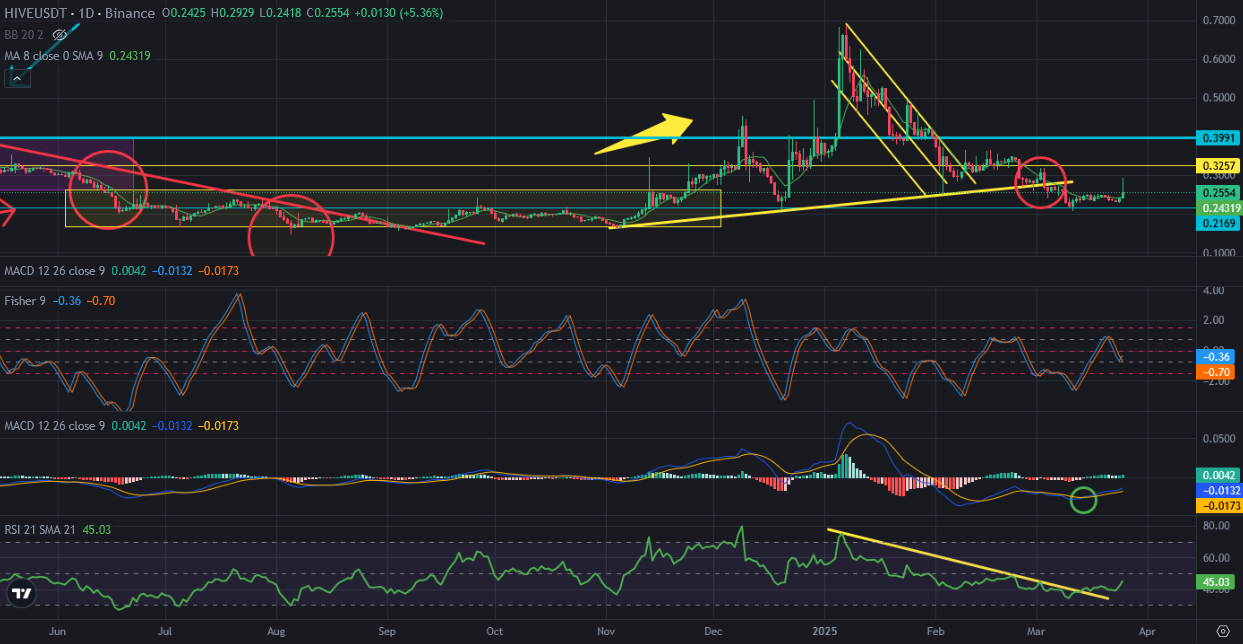
Here you can see the indicators on daily chart of Hive. RSI Indicator broke up downtrend line. MACD Indicator reversed up from the bottom. Fisher Indicator reversed up from the bottom. So, we may see good days for Hive price when we look at daily chart of Hive.
0,26 USD is important level for Hive price chart. It is the top line of depression zone. Hive price should stay above this level.
I shared lots of analysis about Hive price chart and said Hive will be the star of 2025 altcoin season. I hope we will see it. Hive started to move.
We will see..