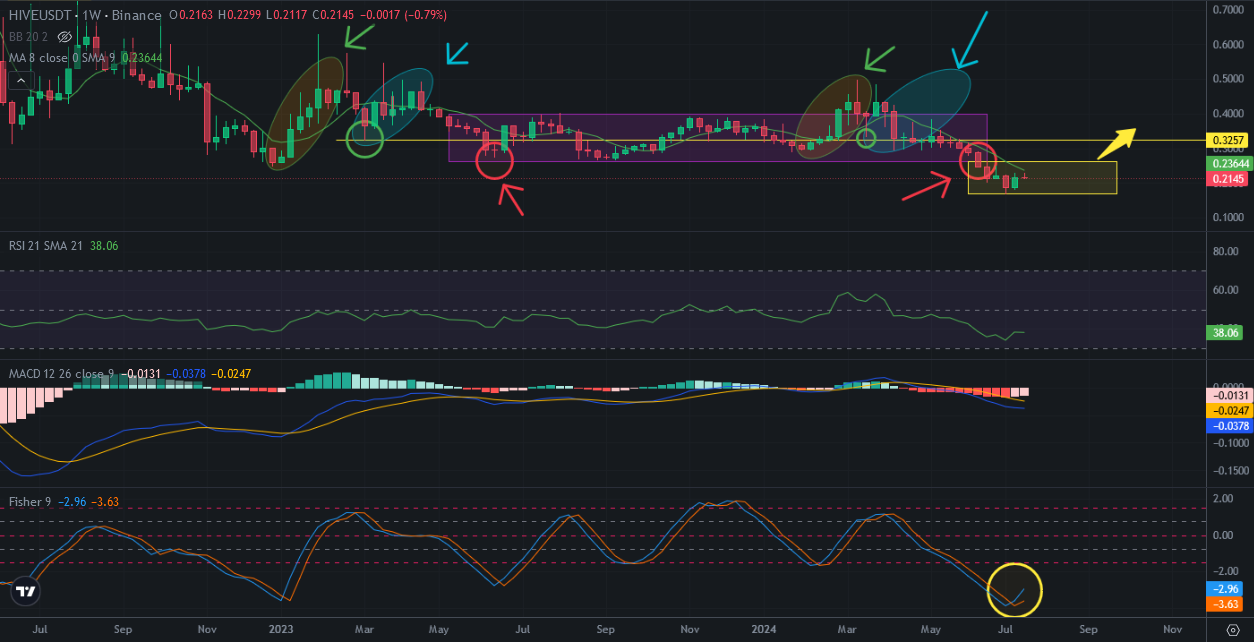
Hive price is under downtrend as crypto market for a few weeks. I shared a few analysis about Hive price chart and said It may be good level to pick up Hive below 20 cents. Because technical analysis showed us the bottom of Hive price chart. Reversing was coming soon. We have seen huge green weekly candle in last week.
This week may be the decision week to reverse or stay as stable. Here you can see weekly chart of Hive. Fisher Indicator reversed from the bottom. We should wait to see MACD Indicators reversing in weekly chart.
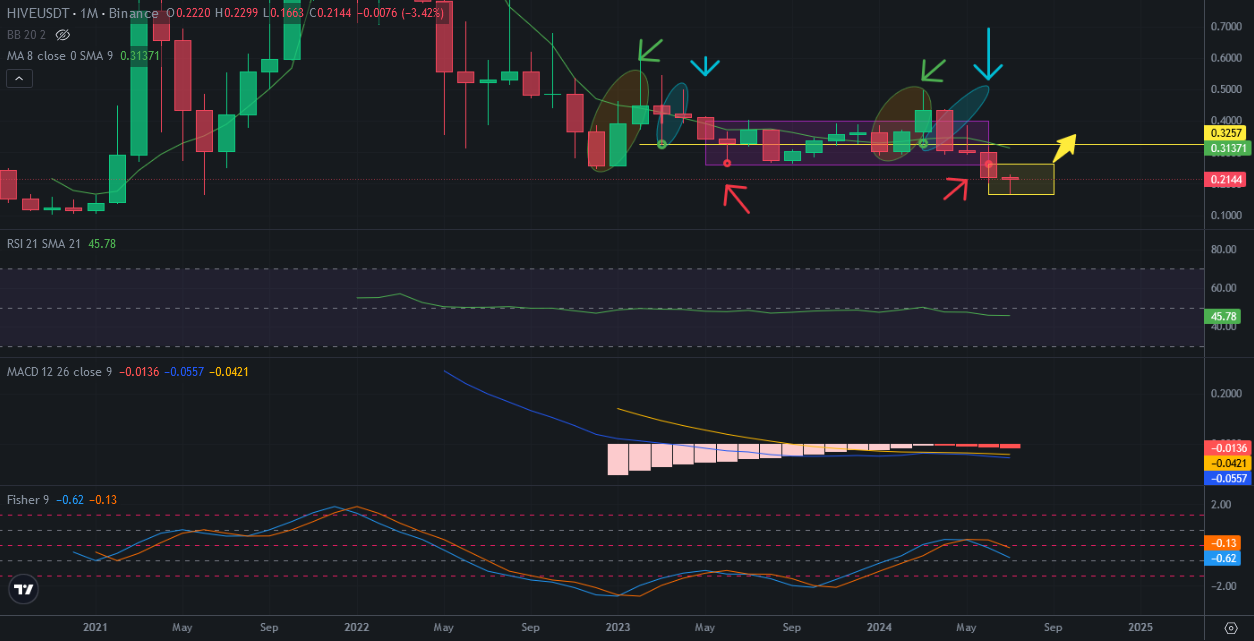
When we look at monthly chart of Hivei we can see 4 monthly red candles. It is the first time to see this red series. Even there are lots of red candles on monthly chart, We may see doji candle which is the proof of reversing in this month. Hive should close this month in this level or higher. It may be great candle for proof of reversing..
MACD Indicator will also try to reverse from the bottom.
Even There are positive signals on Hive price chart, Fisher Indicator is still under downtrend. We need to wait to see it at the bottom. It may take a few months. This is why I will wait until September.
Mega altcoin season is coming soon. It may start in this year. We will see…