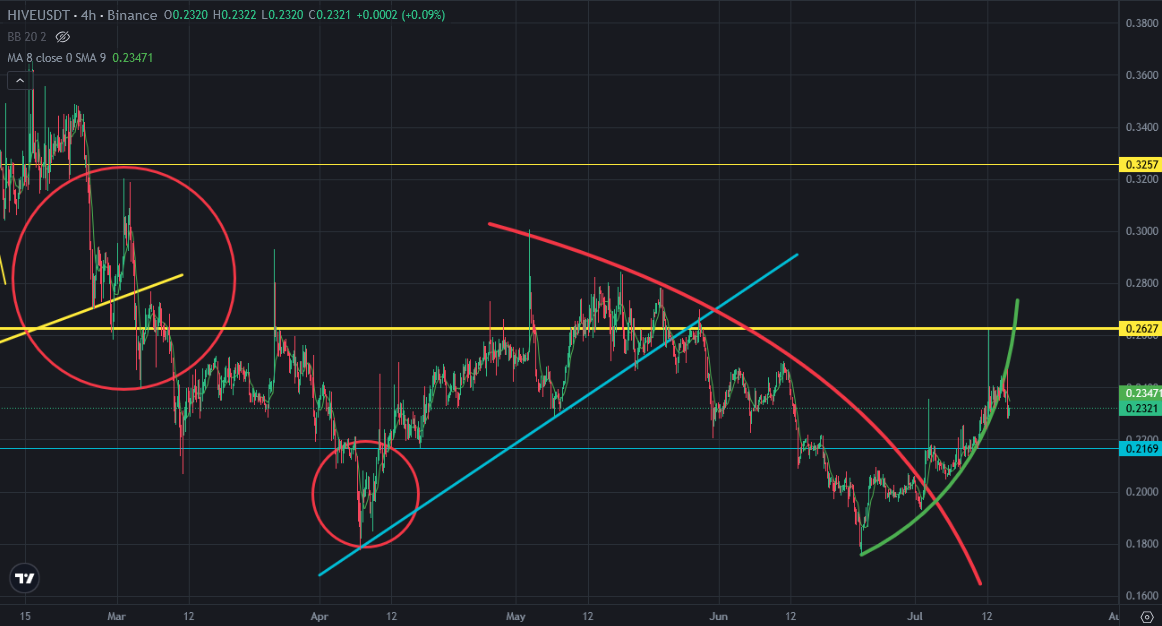
There was a curve support line on Hive price chart. After breaking up mini curve resistance, Hive price went up fast from 0,18 USD to 0,26 USD. Hive price touched the top line of depression zone and resisted.
Here you can see 4-hour chart of Hive price. I shared this draft a few days ago. I said I was waiting breaking down on curve support line. It happened today. Hive price broke down curve support line.
After breaking down curve support line, Hive price may touch the middle line od depression zone. Because It is great support level for Hive price chart.
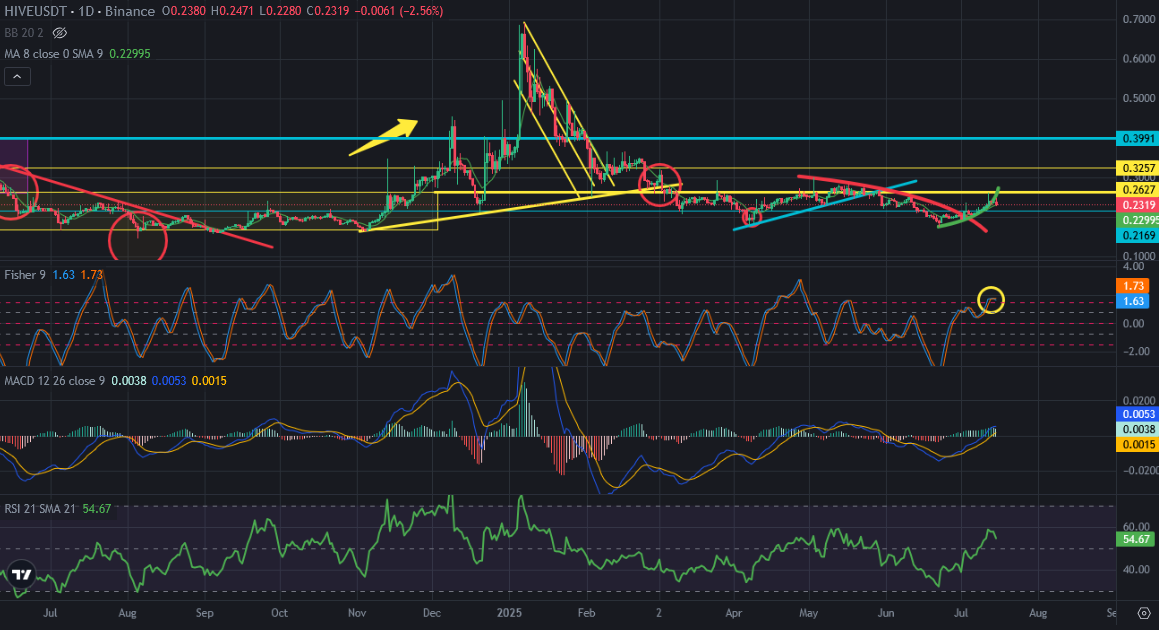
Here you can see daily chart of Hive price. Fisher Indicator is on the top and It reversed down today. If Hive price gets daily red candle today, It will enter correction. MACD Indicator was trying to go above 0 level. If we see more daily red candles, It may reverse down.
I shared a few analysis and said I was waitiong for price correction crypto and stock market at the end of this month. Hive price may be trying to get ready for this possible correction.
We should be careful. We need to see new uptrend pattern. There is no uptrend correction on Hive price chart yet. When Hive price breaks up 0,26 USD, I can say that we entered bullish trend.
We will see..