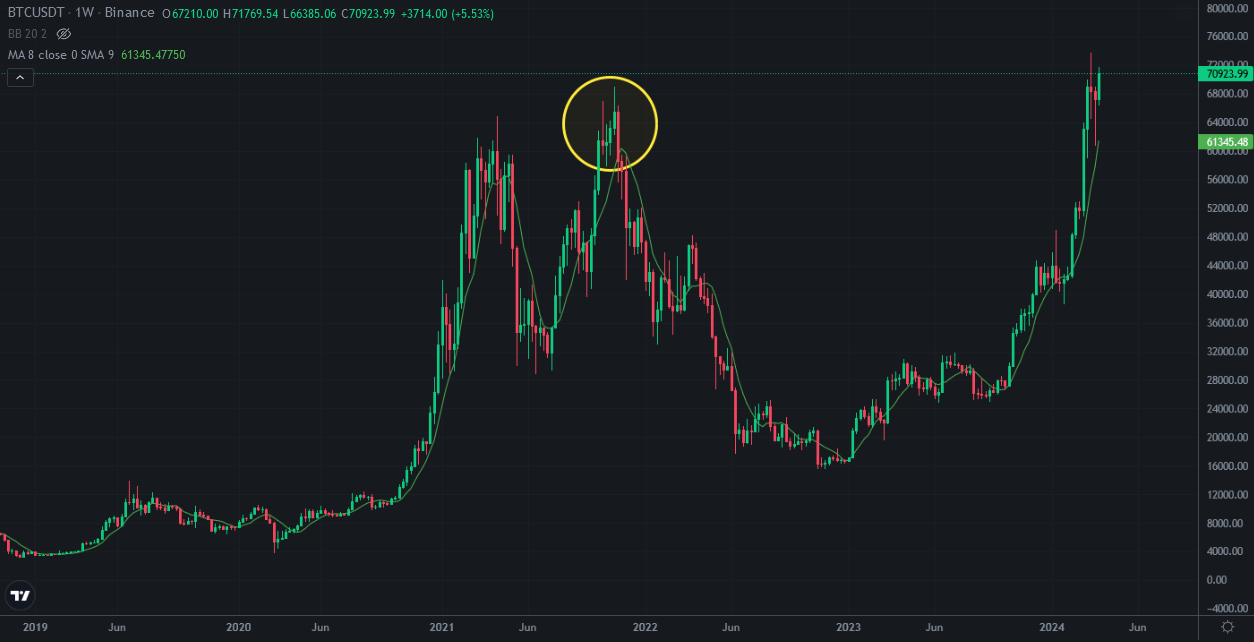
Today is the last day of the week and bullish candle appeared on Bitcoin price chart. The last weekly candle of Bitcoin price chart covered the last two weekly red candles. This is a bullish signal.
We may see uptrend on Bitcoin price chart at the beginning of April. Here you can see weekly chart of Bitcoin and I circled the similarity between 69K level and now. We may see uptrend green candles on Bitcoin price chart and Bitcoin may try to break up 74K.. Price correction may be ended.
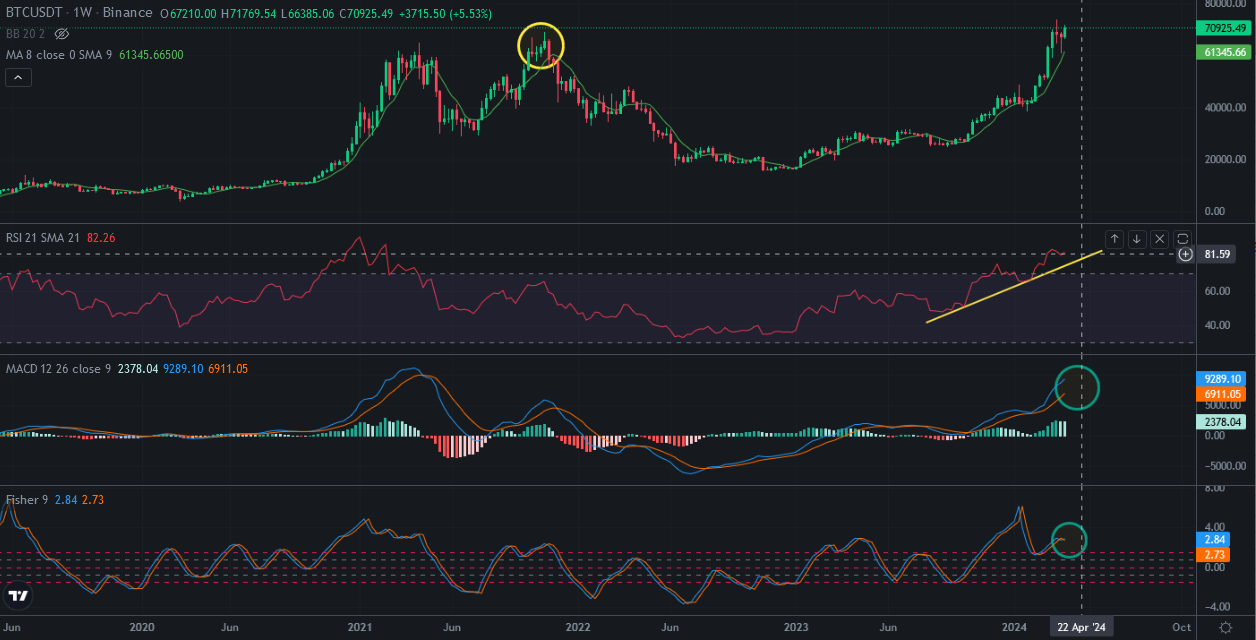
When we look at the indicators of weekly chart of Bitcoin. You can see uptrend support line of RSI Indicator on weekly chart. It will be broken down at the end of April. If it breaks down, MACD Indicator may reverse from top. It will be crash on Bitcoin price chart.
Lots of investors changed to cash to wait halving. Lots of investors are waiting dump after halving.
It may be at the end of April. I will follow RSI Indicator for weekly chart.
So, dont get FOMO after these days. It may be the end of bullish season. We will see price correction on Bitcoin price chart.
We will see…