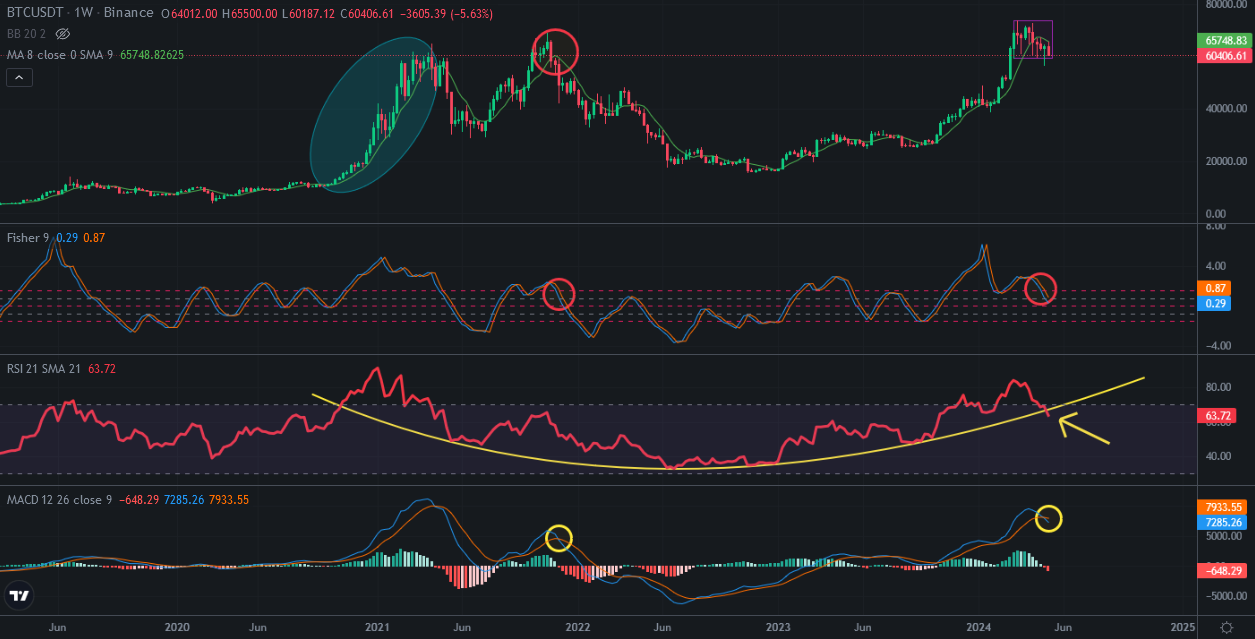
This week is 9th week after touching all time high for Bitcoin. We have seen 7 red weekly candles in last 9 weeks. 7/9 red candle is not good view during bullish season. That means is price correction or reversing of trend.
Here you can see weekly chart of Bitcoin. There was a bowl pattern is on weekly Bitcoin charts RSI Indicator. If we see weekly close about these levels, this bowl pattern will be broken down.
MACD Indicator reversed from the top. I circled the similarities on Bitcoin price chart. We enteded huge price correction. That will take a few months!
I am sure that we entered daily and weekly price correction. Monthly price correction is coming soon!
Here you can see monthly chart of Bitcoin. I circled Fisher Indicator that reversed from the top. There is also bowl pattern as weekly chart of Bitcoin. There is bowl pattern on RSI Indicator may be supported by this pattern. MACD Indicator may reverse if we see a few red monthly candles.
These are major signals for bearish chart of Bitcoin. Bitcoin may enter price correction for monthly chart!
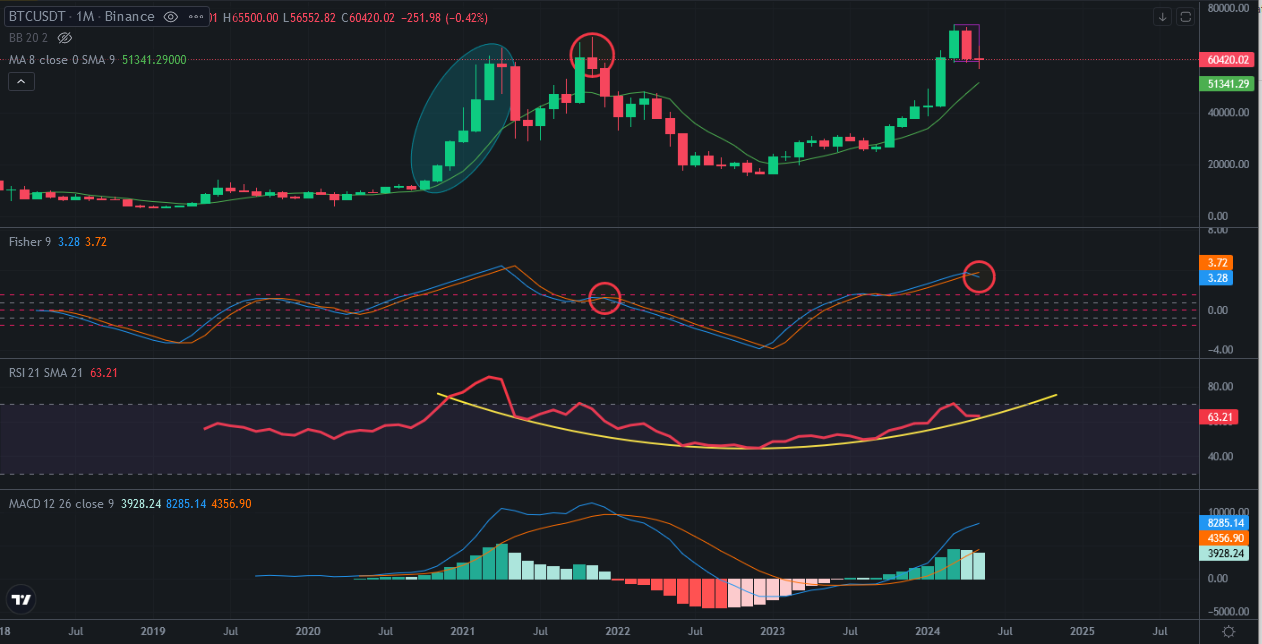
If we enter price correction on monthly chart, we may wait a few months. We may enter again bullish trend at the end of 2024 as 2023.
It is more possible.
We will see..