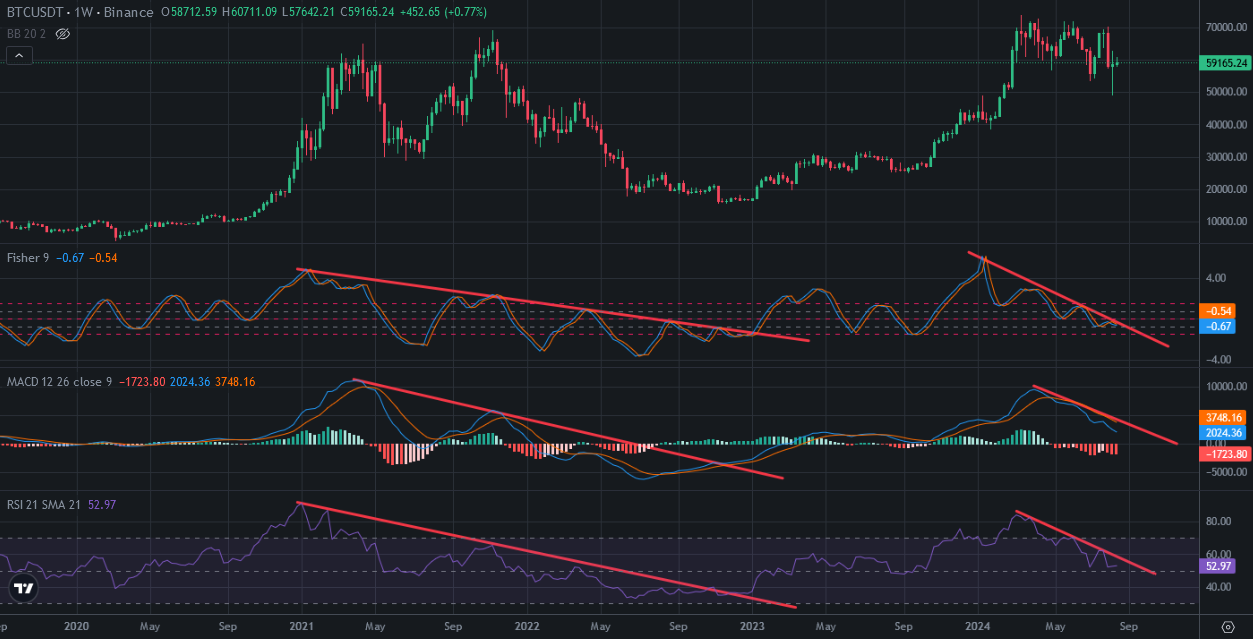
Bitcoin price can not go up. It is still under price correction. There are lots of downtrend lines on the indicators of Bitcoin price chart.
Here you can see weekly chart of Bitcoin. I drew the downtrend lines on the Indicators. Bitcoin should break up these lines if it wants to enter bullish trend again. It is impossible to see before breaking up these lines.
You can see what happened after breaking up these line at past. These downtrend lines will be broken up until 2025. Bullrun will start until 2025…
Here you can see monthly chart of Bitcoin. Fisher and MACD Indicators are on the top. If MACD Indicator reverses from the top, We may not see bullish trend in 2025. It will take long time to enter bullish trend again..
Next month will be so important for crypto market. If we see red candle, we may enter mega bearish season!
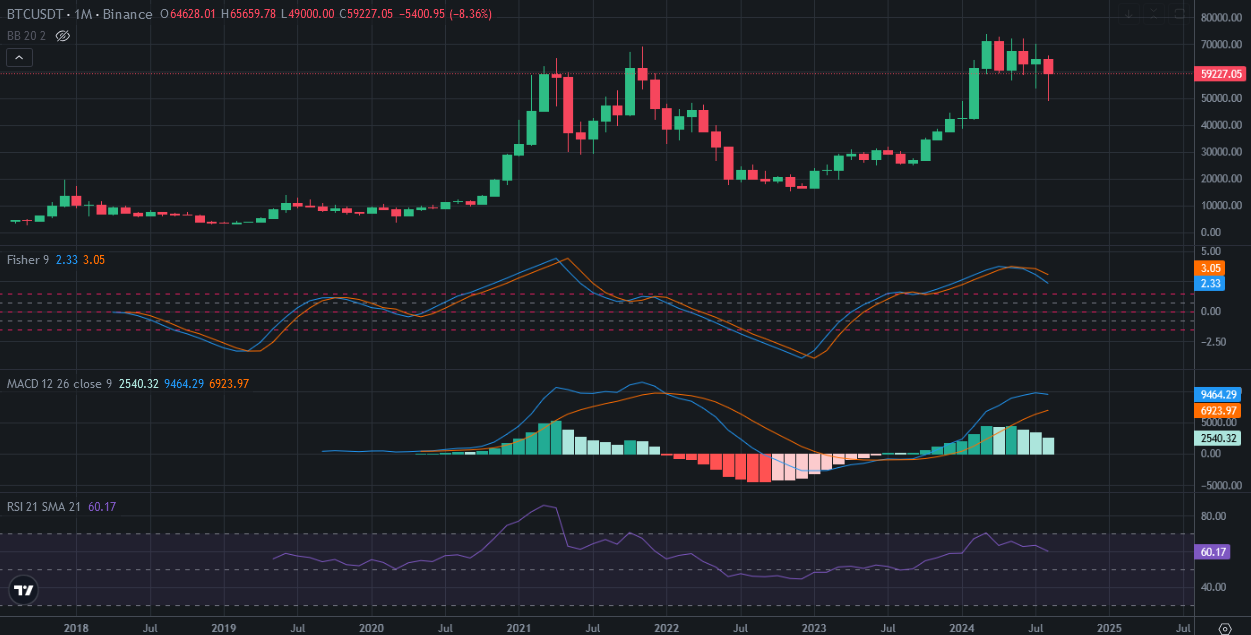
Weekly chart seems bullish for Bitcoin. Monthly chart seems bearish for Bitcoin. We will see which one will beat.