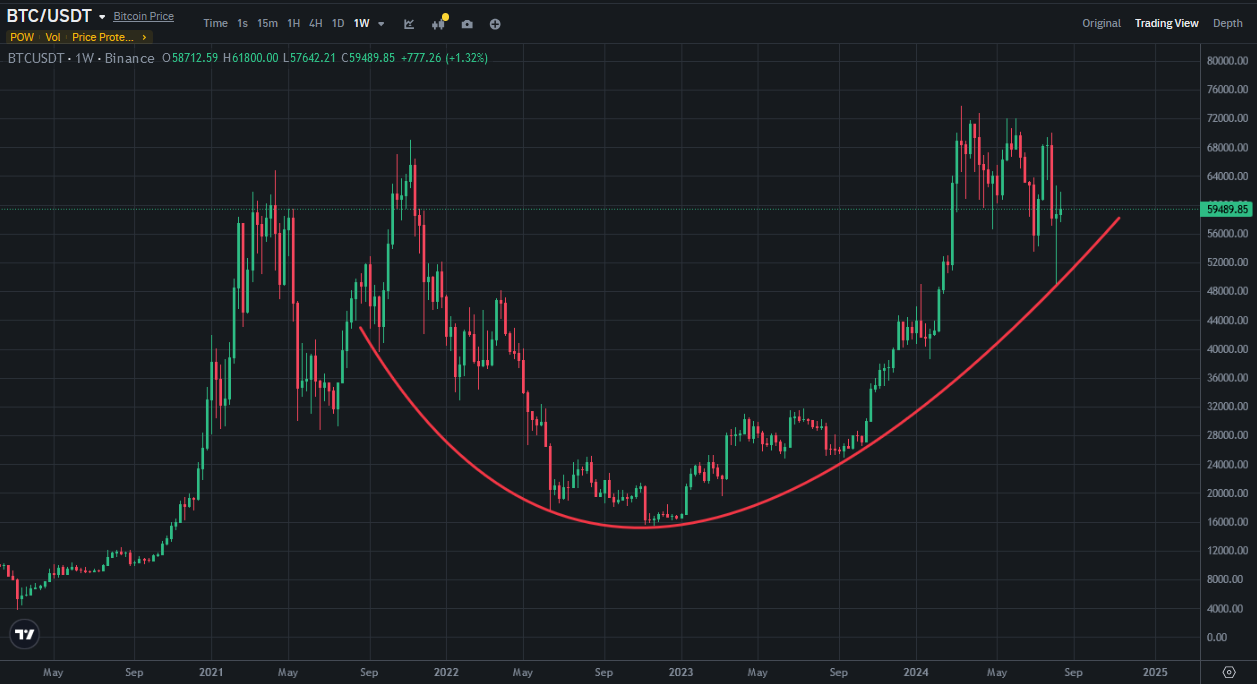
Bitcoin price touched 47K a few days ago. It was suported by bowl pattern coming from the beginning of 2022. I showed this pattern a few months ago. It worked as well..
Here you can see weekly chart of Bitcoin and I drew the pattern which I said. When Bitcoin price hit 47K USD, It is supported by this pattern. Will Bitcoin price break down this pattern?
Bitcoin price is still in this pattern and It will try to increase logarithmic. If it breaks down, we should see the new bullish pattern. I will take at least a year…
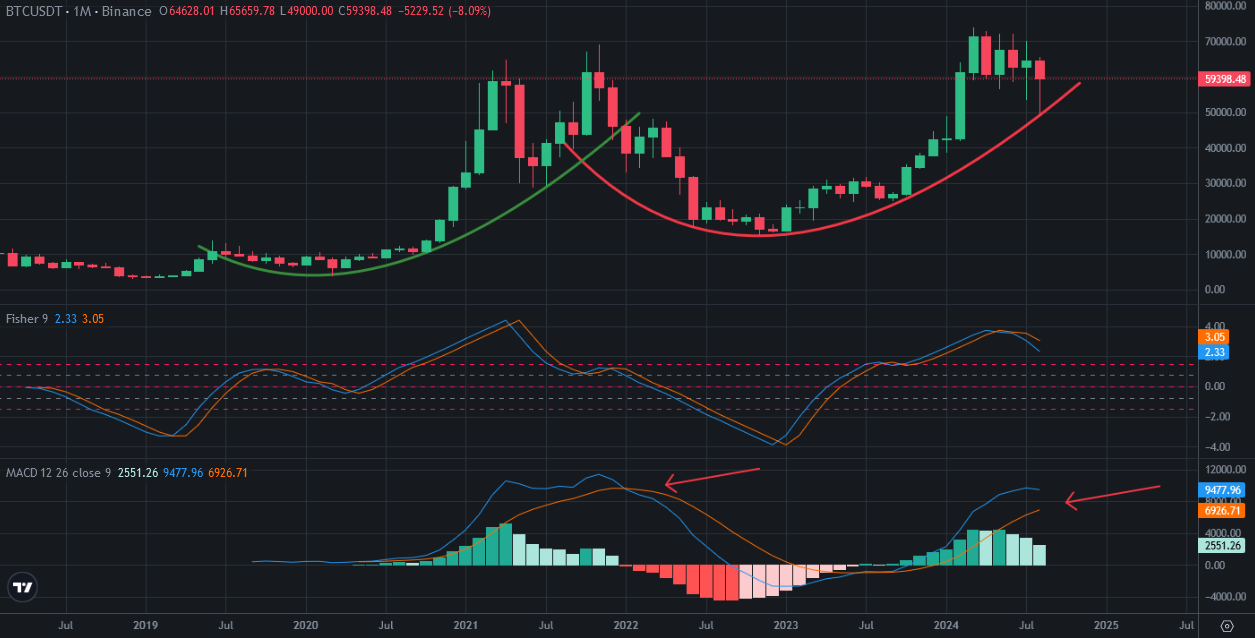
Here you can see monthly chart of Bitcoin. You can see what happened after breaking down bowl pattern. I drew the last bowl pattern as green and It is broken down at the beginning of 2022. You can see what happaned after breaking down.
MACD and Fisher Indicators are at the same level which I said. If we see red monthly candle in next month, we may see same scenario. Bowl pattern may be broken down in next month.
Fisher Indicator is also reversed from the top. We may see price drop If this pattern break down..
We should follow this trend for 2023-2025 bullish trend. Bitcoin should not see 47K USD below. If it touched below, we will enter bearish trend.
We will see..