We can not see volatility on Bitcoin price chart nowadays. Tomorrow is full moon day. Bitcoin price may wait this date. I shared a few analysis about astorlogical calendar. Markert maker always looks this calendar. Full moon may be trigger for high volatility on Bitcoin price chart.
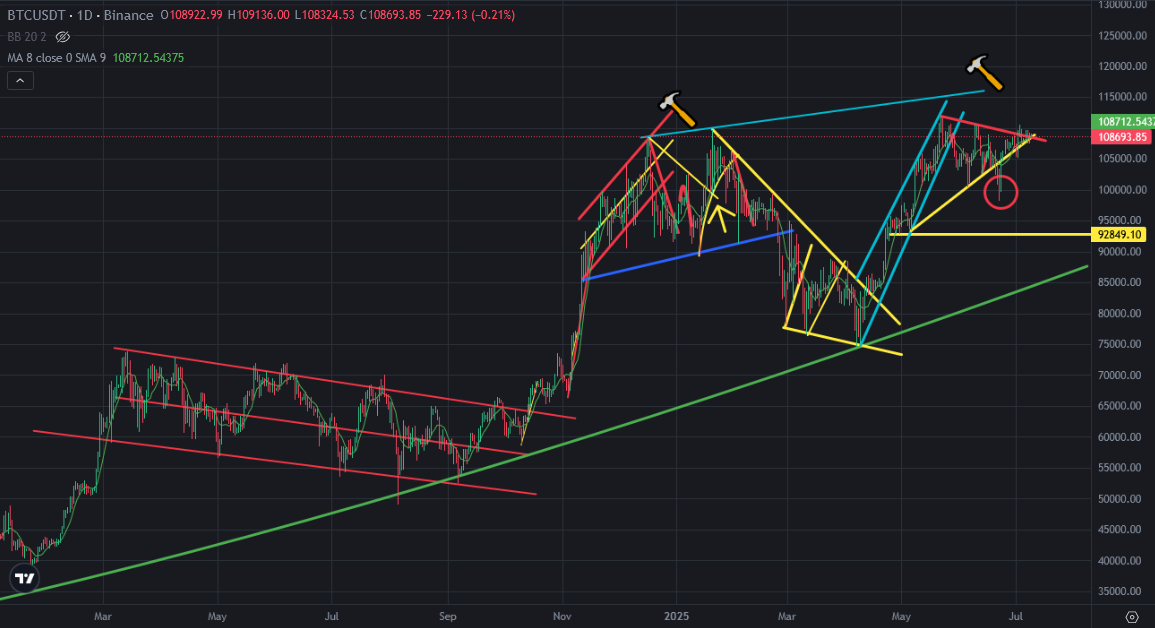
Here you can see daily chart of Bitcoin price. Even Bitcoin price seems as breaking up mini downtrend line, it can not go up. If it can go up, it will touch all time high. But It may be early to see new all time high. Because market maker sold in May and went away to holiday.
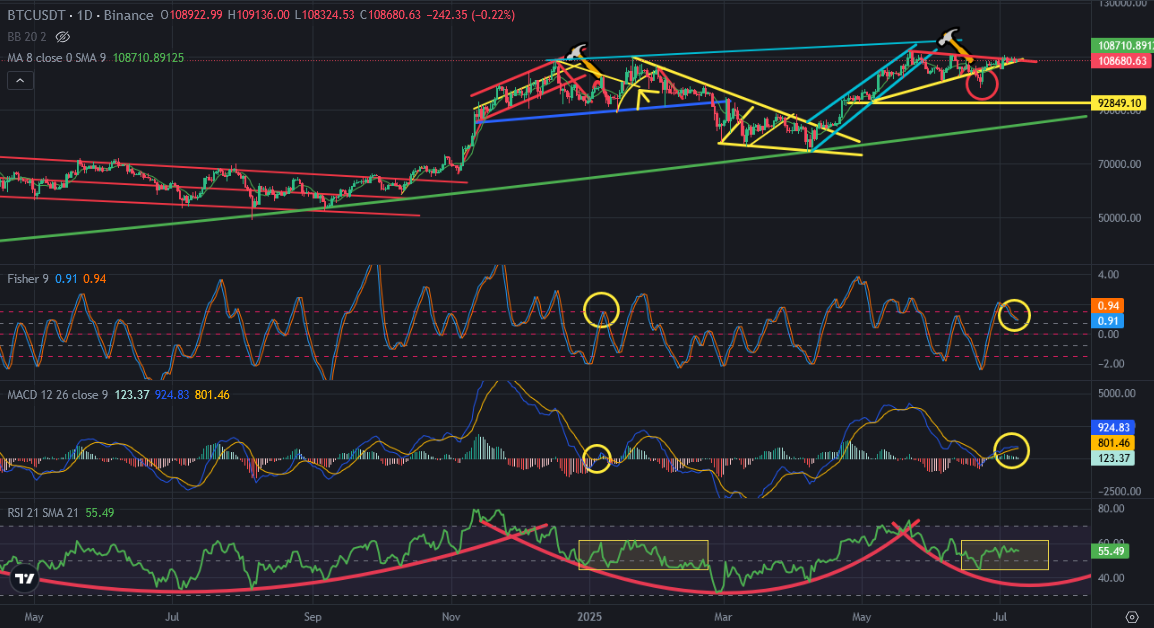
Here you can see the indicators on daily chart of Bitcoin price. There are lots of similarities between past and now. I shared this draft a few months ago It is so possible to see same price move on Bitcoin price chart.
Even Fisher Indicator is going down the price is trying to stay strong. It may be only one of bullish signal on Bitcoin price chart. But MACD Indicator is getting close to reverse down. RSI Indicator is in consolidation channel. We may see the touch the bottom of this channel and depression move after breaking down this channel as past.
I may be hard to go up without killing long investors. I think Bitcoin price will go down to make depression move and go up. It may be hard to see all time high in this Summer.
We will see..