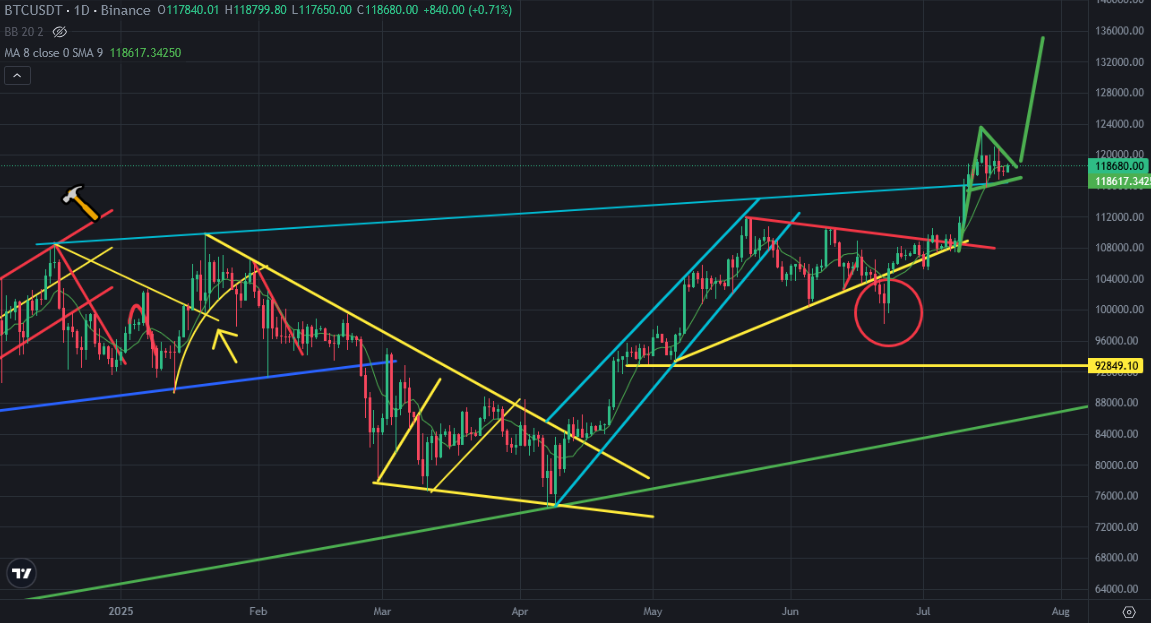
Bitcoin price is in flag pattern which is a bullish pattern. Bitcoin price is in bullish trend from 96K. It went up without any price correction more than 10%. Even it touched 122K, it reversed down only 5% from all time high level. It is still solid while going up. We are 2nd montt of bullish run of Bitcoin price.
Here you can see daily chart of Bitcoin. Bitcoin price stuck into flag pattern. There was resistance on Bitcoin price chart coming from all time high. Bitcoin price broke up this resistance. After reversing down from 122K, Bitcoin price touched this resistance as a support and It is supported by this line.
We are going to end of flag pattern. We should see price pump or dump on Bitcoin price chart. Flag pattern are bullish pattern. It is so possible to bullish move on Bitcoin price chart. The target of this pattern is to touch 135K USD.
Here you can see the indicators on daily chart of Bitcoin price. Even Bitcoin price is in bullish pattern, MACD Indicator is close to touch the resistance. You can see how it resisted by this resistance before. Fisher Indicator is going down. It may try to complete correction before bull run. MACD Indicator is close to reverse down. So, Bitcoin price should go up. If not, MACD Indicator will reverse down and we may see price correction on Bitcoin price chart.
MACD Indicaotr should go up in a few days for not to reverse down.
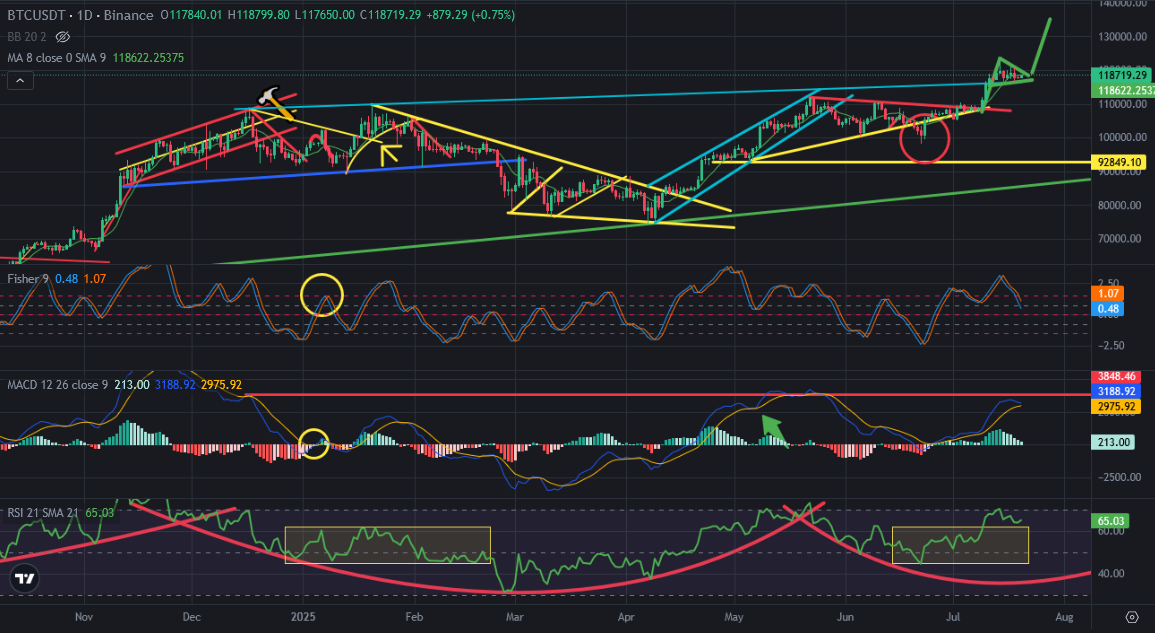
We are close to decision. We will enter the result of bullish pattern or we will see breaking down great support line. Next week is so important.
We will see..