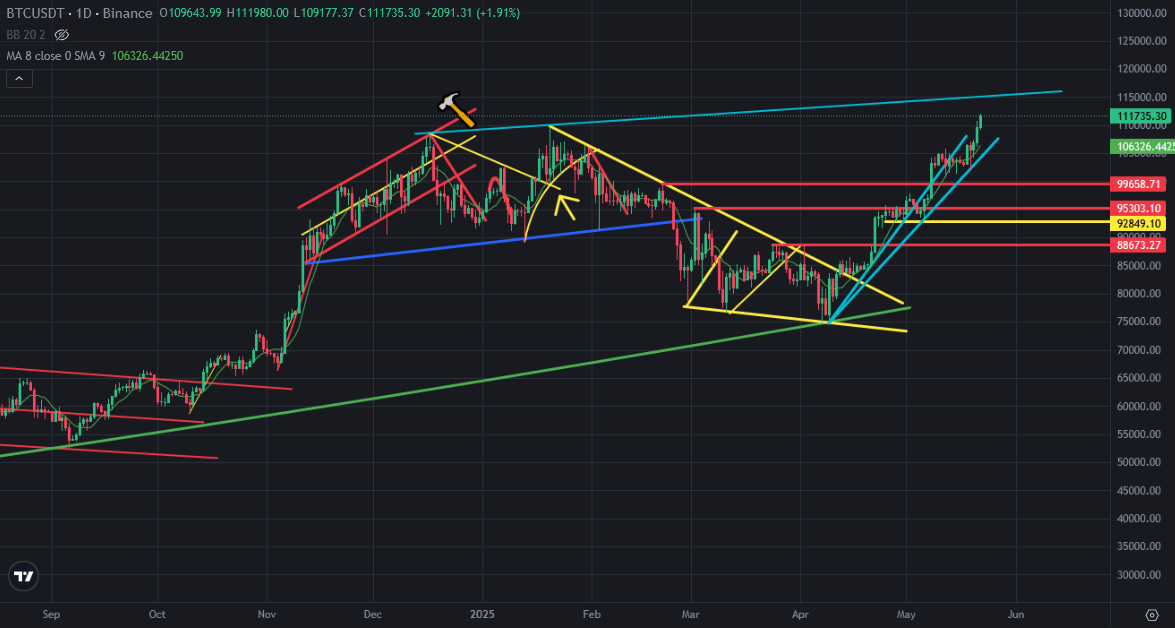
This is the 4th step of going up on Bitcoin price chart after touching 76K. Bitcoin price is going uo without any price correction. It is hard to predict the level where Bitcoin price will enter price correction.
Here you can see daily chart of Bitcoin. There is the last resistance on Bitcoin price chart after reaching all time high. Bitcoin price is increasing all time high level day by day. The nezt resistance is at 115K USD level where is the top level of Bitcoin in 2025.
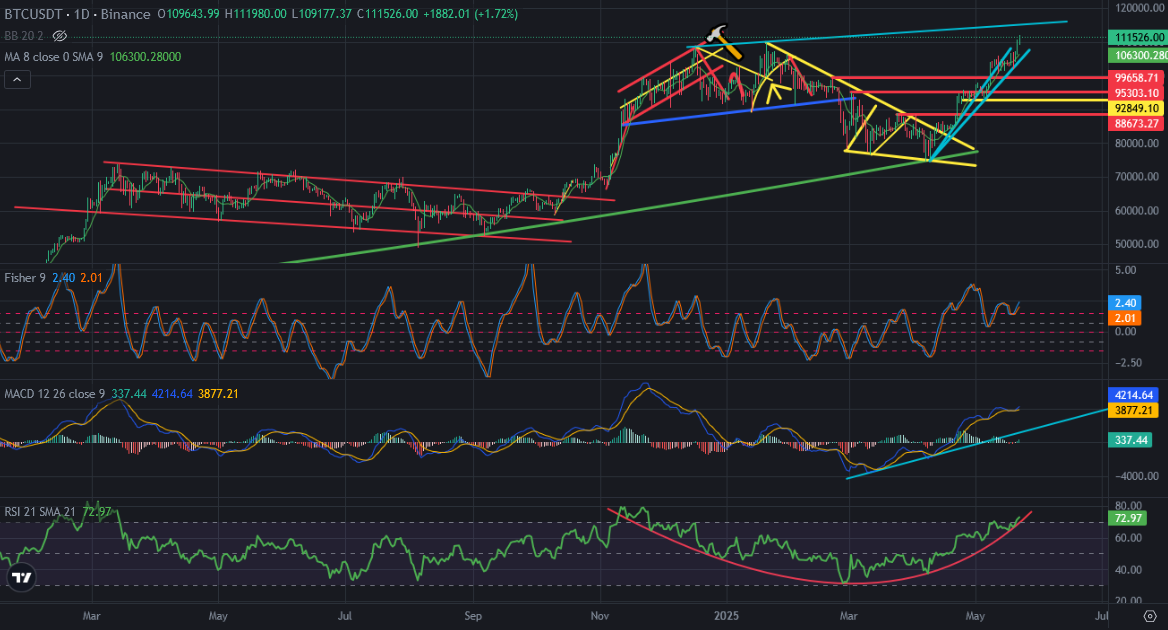
Here you can see the indicators on daily chart of Bitcoin. Due to going up without any price correction, the indicators levels are increasing. There is updated bowl pattern on RSI Indicator. We may see breaking down in this indicator in a few days. There is uptrend line on MACD Indicator. The level of MACD Indicator reached as same level as the end of 2024. So, All of indicators need correction.
We are still in 7th green weekly candle. We need red candles to see price correction.
Bitcoin price chart needs red candles to have healthy bullish trend. If not, It is possible to see huge price drops. We should see price correction in a few weeks.
We will see..