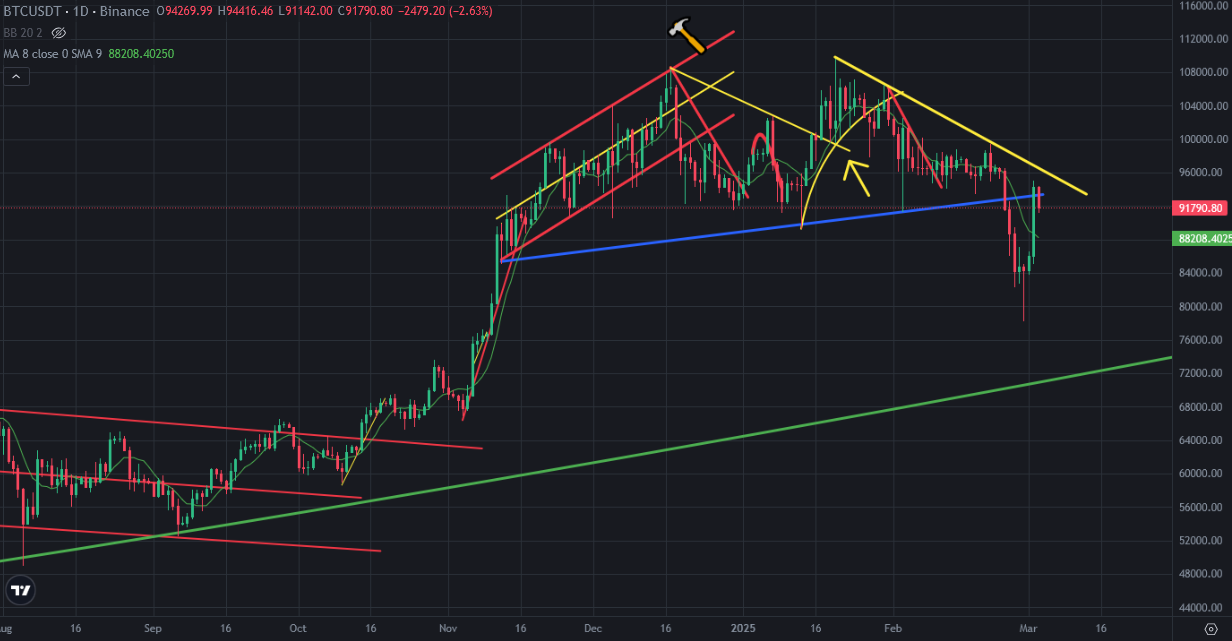
Bitcoin price got huge green candle yesterday. It was one of the biggest green daily candle in last years. Even Bitcoin price went up fast, It has not yet broken significant resistance.
Here you can see daily chart of Bitcoin. Bitcoin price touched past support line. It is great resistance now. There is great downtrend line coming from 108K USD. It is the second great resistance on Bitcoin price chart.
It may be a retest of downtrend? It is still early to say that it is great bulish season. We should wait until to see breaking up these great resistances..
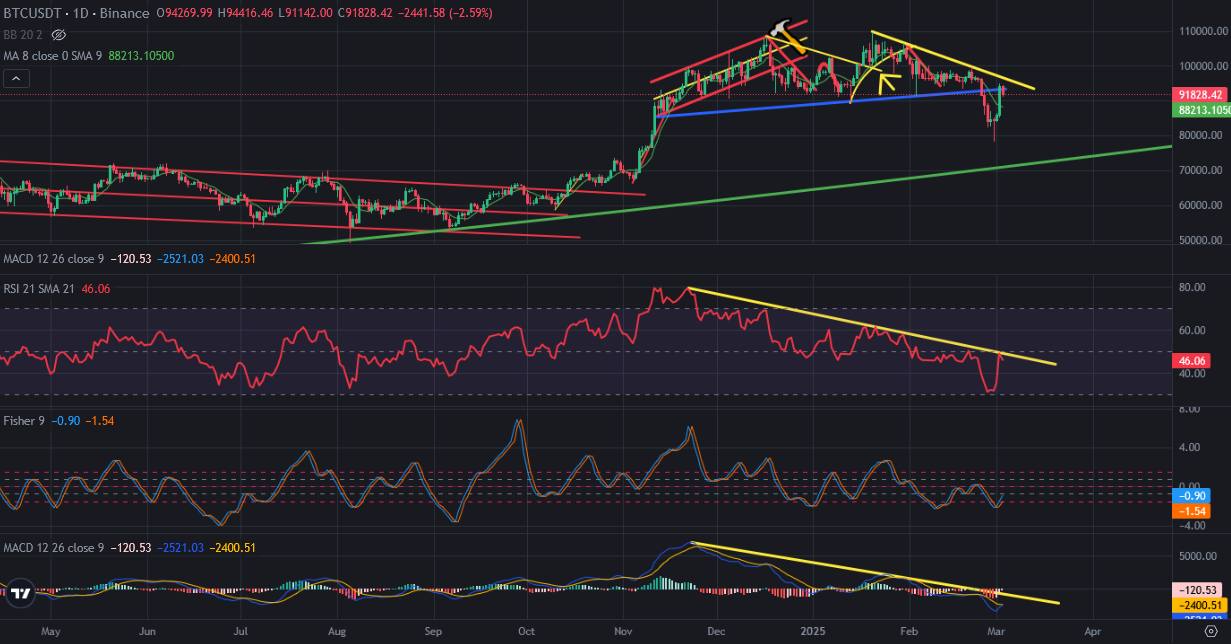
Here you can see the indicators on daily chart of Bitcoin. There is great downtrend line on RSI Indicator. There is also great downtrend line on MACD Indicator. Bitcoin will break up these downtrend lines on indicators.
Fisher Indicator is at good level to go up. It reversed and ready to go up. If it goes up, RSI and MACD Indicators will be broken up.
If these scenario happens, Bitcoin may break up yellow downtrend line on Bitcoin price chart.
So, we may see big breakin up on Bitcoin price chart in next days. Resistanes are testing. They will be broken up..
We will see..