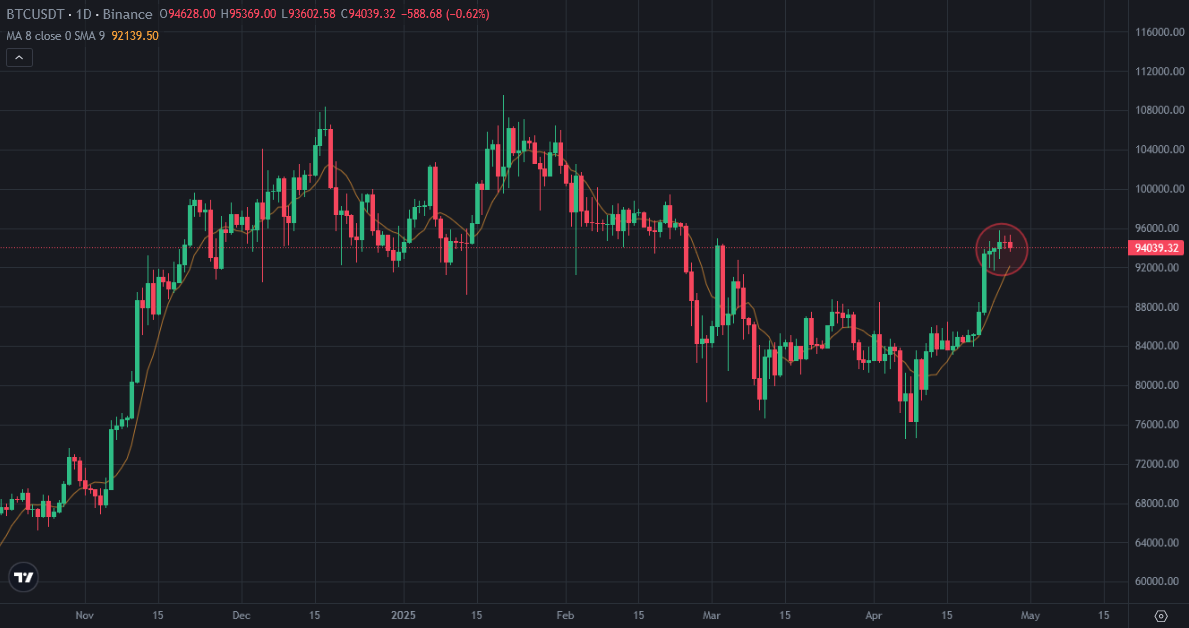
Bitcoin price went up fast with huge strong green candles. It went uo from 76K to 95K in a few days. Bitcoin is at second step of bullish move. Bitcoin price got weak candles in last 5 days. It may be for resting before 3rd bullrun or It may be the reason for reversing down.
Here you can see daily chart of Bitcoin. After getting three weak green candles, red candles staterd to appear on Bitcoin price chart. This is the second day of red candle. We have not seen two red candles in the first step of bullrun.
Here you can daily chart of Bitcoin and the indicators. I shared a few analysis about the indicators on daily chart of Bitcoin. MACD and RSI Indicator are touching the resistances. Fisher Indicator is on the top and may reverse down from this level.
If we see third red candle on daily chart of Bitcoin, we will see reversing down on Fisher Indicator. RSI and MACD Indicator will be resisted by great resistances. So, we may see reversing down on Bitcoin price chart.
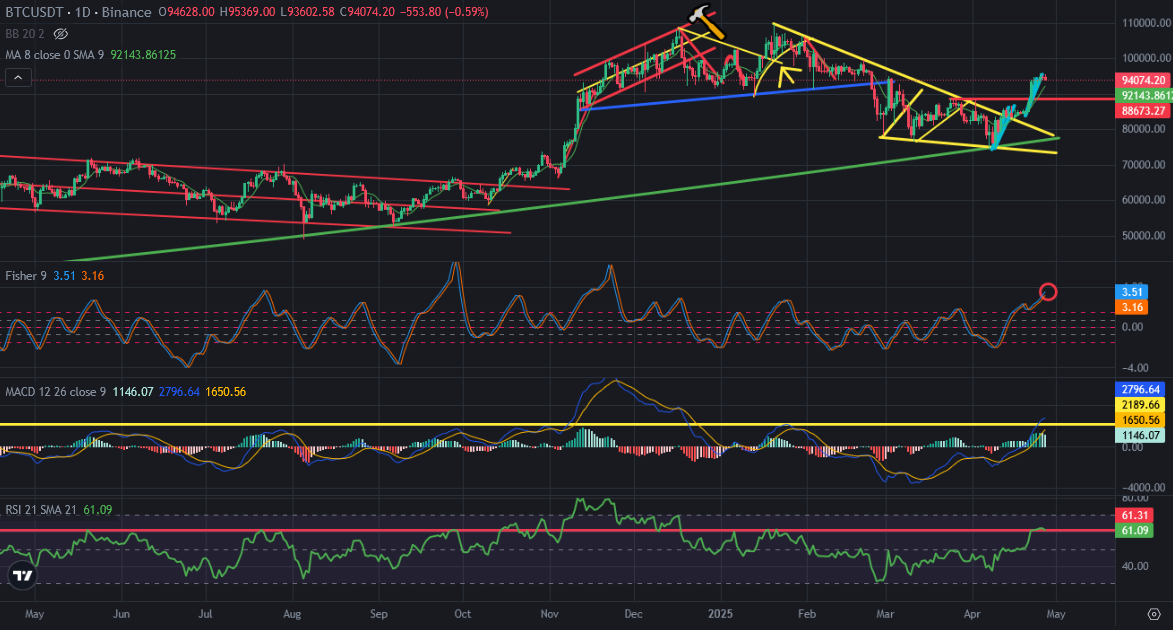
95K USD is getting stronger resistance for Bitcoin price chart. We are close to enter May. Market maker likes ''Sell in May, go away''. Will it be true in this year?
We will see...