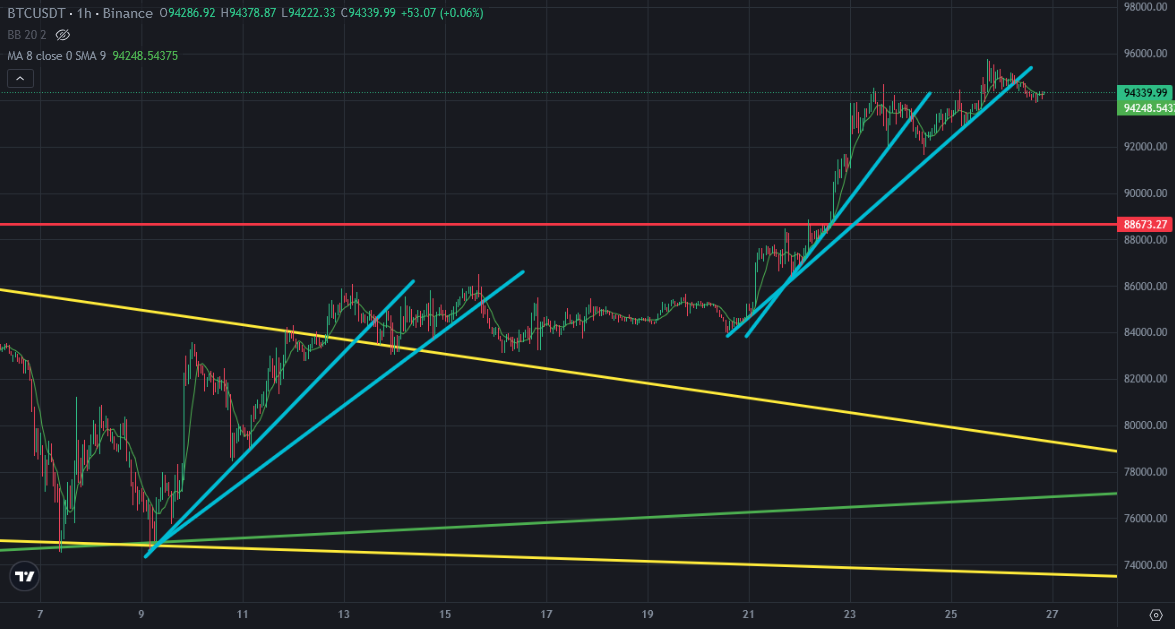
Bitcoin price is going up step by step. This is 2nd step of bullish trend. There are mini uptrend bullish lines on Bitcoin price chart. I shared lots of analysis and said Bitcoin price will break down mini uptrend line. After breaking down on 2nd mini uptrend line, Bitcoin price appeared stable. It is the second step of bullish trend. Bitcoin is resting before bull run.
Here you can see hourly chart of Bitcoin. This is why I said this is 2nd step of bull run. There are similarities between last bullrun and now. It is time to complete the correction. So, we may see Bitcoin price at these level during a few days to complete corrections.
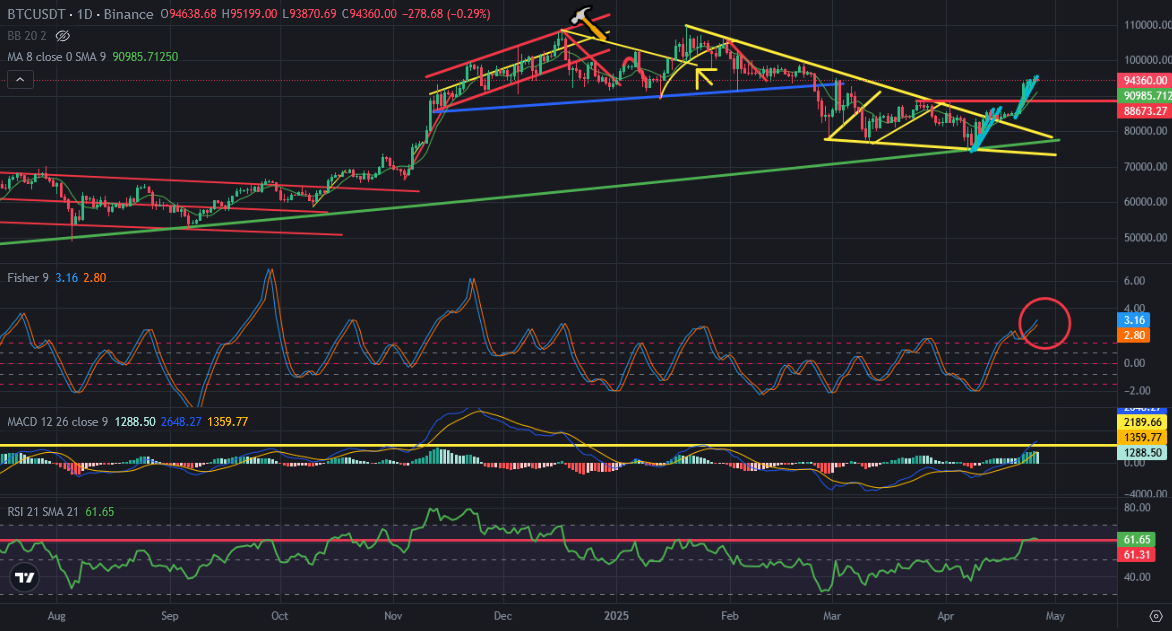
Here you can see daily chart of Bitcoin. Fisher Indicator is increasing. It is going to end of bull run. We may see reversing down from the top on this indicator. Today is the first day with red daily candle after 7 green candles. If we see more red candles on daily chart, we will see reversing down on Fisher Indicator.
RSI and MACD Indicators are still resisted by the resistances. So, it is so possible to see reversing down on Bitcoin price chart in daily chart.
Even Bitcoin price chart seems bullish for short-term, we may enter price correction on midterm. So, Bitcoin may do same thing. ''Sell in May, go away'' is not only a motto.
We will see..