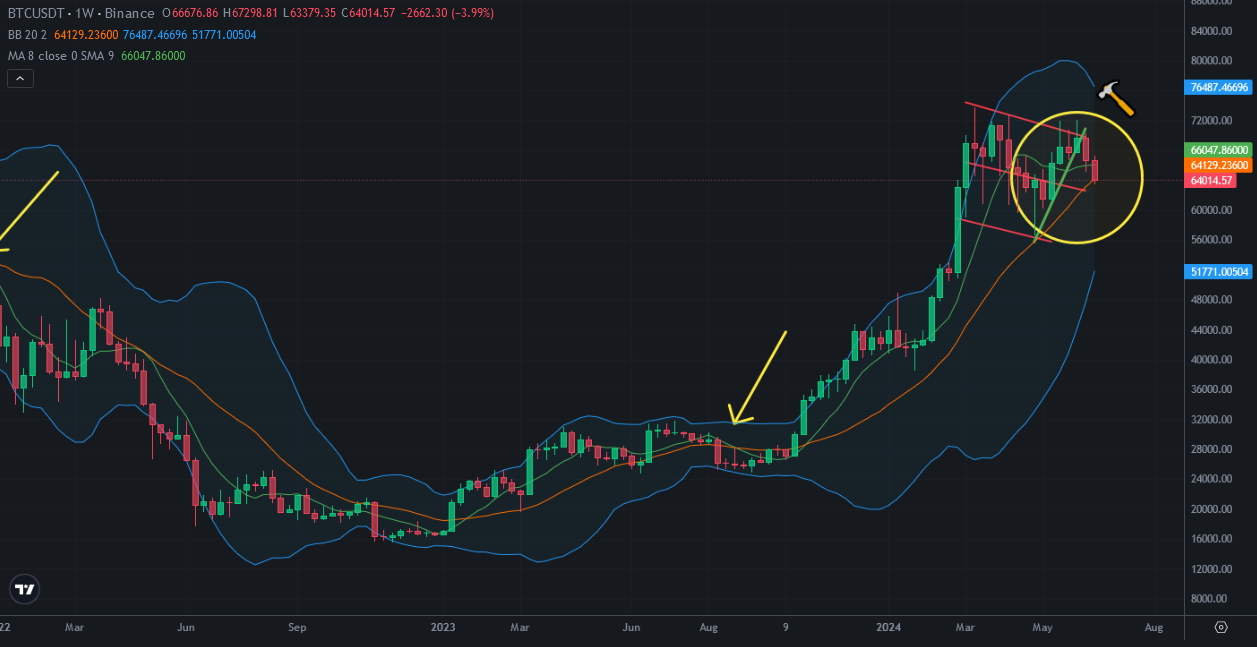
The middle line of Bolinnger Bands in weekly chart of Bitcoin price is one of great support. Today is the last day and Bitcoin is trying make weekly close above this support line.
Here you can see weekly chart of Bitcoin and I shared this draft a few weeks ago. There was a descending channel on Bitcoin price chart. Market maker did lots of bullish and beraish traps in this channel. It was very hard to predict the direction of Bitcoin price move.
I shared lots of analysis and said I would be out of market until seeing price move. Bitcoin broke down support line as green and the middle line of descending channel is first target for Bitcoin price. It is close to touch this line.
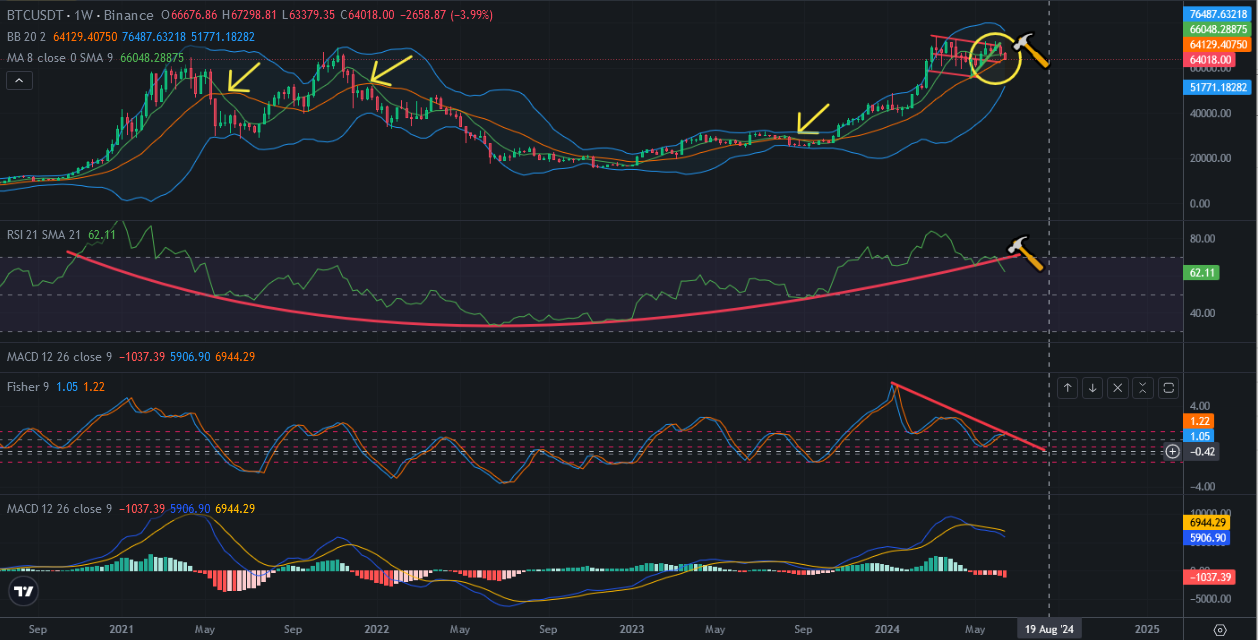
When we look at the indicator on Bitcoin price chart, we can say that Bitcoin will be under downtrend pressure unntil August. August is possitive time for bearish period. It may take long time to enter bulish trend.
Here you can see downtrend line on Fisher Indicator and this is why I say that It may take at least until August. It may break up this downtrend line in August or later.
MACD Indicator is also at bearish trend It needed correction. It may take a few weeks or months.
I will be out of until August. I will watch the market moves.
Bowl pattern on RSI Indicator is broken. We need to see new pattern on Bitcoin price chart.